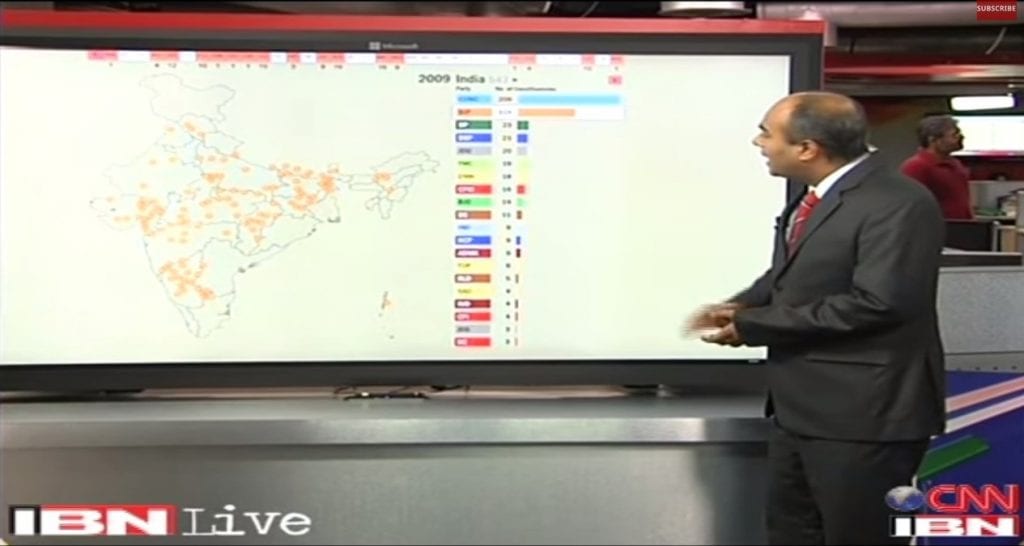
Big data means big elections and Hyderabad-based Gramener, the Data Visualization & Analytics platform provider, is no stranger to the election frenzy. It was Gramener’s insightful and dynamic visuals that drew out the audiences for Times Now channel in the 2016 elections. While political campaigns and data visualization can be a tricky mix, the Gramener team tackled the odds by “learning politics and asking subtle questions”.
The company forayed in visual data journalism in 2013 and has gained serious street cred in visualizing election campaign data. Some of the ripple effects of their analytically and visually rendered campaign data were – 80% primetime viewership, and eliminating uncertainty by “putting the numbers out there, there was no theorizing”.
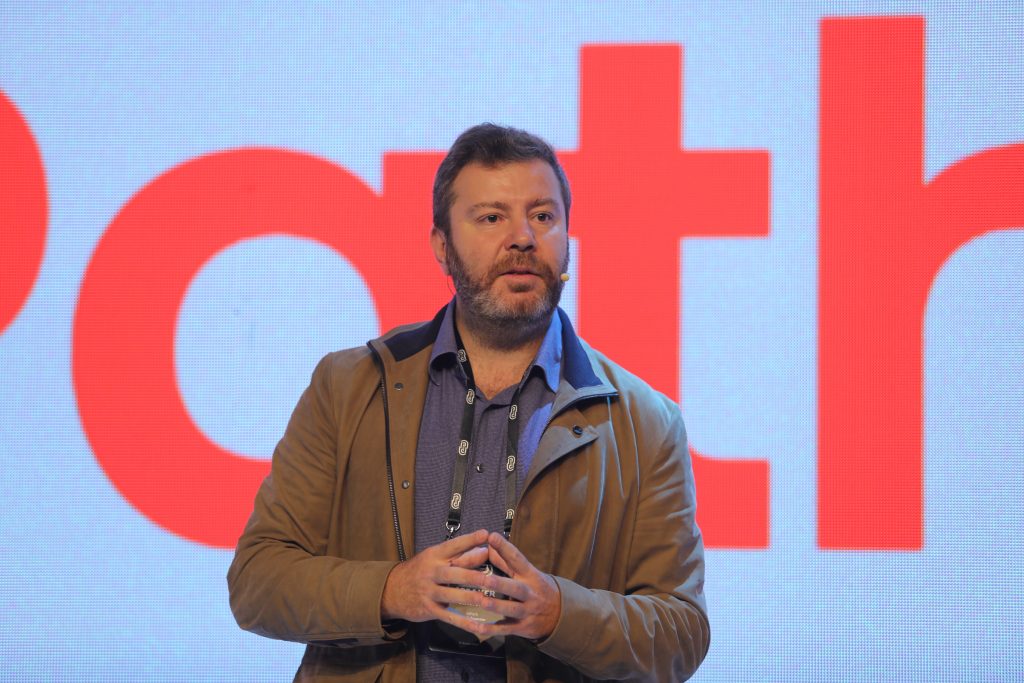
Times Now data advantage will be leveraged by its rival channel now. With the 2017 elections around the corner, the company is all set to navigate the political maelstrom with top-notch, interactive visuals for TV 18 network. Visualization is Gramener’s core competency and S Anand, co-founder and CEO has admittedly been in the throes of live election coverage, living and breathing the election campaign data for weeks on end. One of India’s most celebrated and revered Indian data scientists, admittedly “doesn’t know much about Indian politics”. That apart, the 42-year-old CEO definitely knows the science behind it.
Gramener CEO S Anand gives us the lowdown behind the stellar, eye-grabbing data-centric storytelling:

At the heart of their success is Gramex platform, the homegrown platform that uses an open source component and stands on several technology stack.
Front end visualization
Interactive visuals need to respond to changes, such as update in data, resizing of display or a change in colour. There are three kinds of visualization paradigm in vogue today:
Templating: This intersperses programming logic in the middle of content. Think PHP. Handlebars is a representative library in this space. Gramener uses Underscore – that provides templating along with other utility functions.
Data Binding: This approach is best represented by D3. The flexible library allows selectively binding input data to document elements and applying changes to generate and revise content. D3 works well when output needs to dynamically with changing data. This pattern has become the gold standard in data visualization. However, the D3 approach involves a lot of learning and effort from developers even to build simple visualizations.
Reactive approach: This approach combines templating with data binding. Templates are updated dynamically and minimally. This approach uses a virtual screen (called “virtual DOM”) to note all the UI changes and brings the UI up to speed with the latest changes. Here’s a bit of trivia about React.js, it was born at Facebook as a set of best practices for building reactive user interfaces.
Here’s what goes on in the back-end
The back end needs to crunch numbers rapidly. That’s why Gramener’s platform runs on the Pandas library for data processing and makes use of Tornado framework, the scalable web application framework known for its speed in handling a large number of client requests and high volumes of traffic. “You need a framework that serves output without causing any delay. That’s why we use Tornado framework,” he shares.
Here’s a common scenario demonstrating the need for responsiveness on server side:
- Say for example, browser demands a result from a database and an image
- The web server receives the request and sends it to the database
- While waiting for the database response, the web server takes the next request from the browser and serves the image
- When the database responds, the server sends the response to the browser
This ensures that the server is not idle waiting for other requests. This event-driven approach is how high-performance servers like nginx break the 10,000 requests/second barrier.
Things to watch out for in Election Data Visualization
As Anand reveals, during live broadcasting nobody really conceives how a story will flow. “Around 75%-80% is planned, the rest 25% is buffer,” he lets on. The anchor has to be familiar with the interface which is truly interactive and dynamic. The visualization team has to keep a tab on what kind of interactive analysis or paths the anchor will be taking and drive the sequence of visuals accordingly. Secondly, what’s onscreen has to be updated fast, only then is it classified as Breaking News and analytics has to keep pace with it. Thirdly, unstructured data that is not machine readable, anomalies in spellings and ill-defined constituency boundaries that are reshaped and recasted add to the data cleansing job that is a “bit of a nightmare”.
Autolysis – Gramener’s Exploratory Data Analysis tool
Automated analysis tool was born out of the need for automating tasks such as automating insight discovery, data extraction, data cleansing and data classification among others. The tool enables discovering insights without any programming or data analysis knowledge.
Anand revealed in an earlier interview to Analytics Indian Magazine that he is a “believer in machines more than people, as machines can do a lot as well, therefore what I am trying to do is seeing how much of what we are doing can be automated.” The result — the algorithms can automatically find answers to questions like:
- Which are the best performing branches?
- What drives the price of a product?
- Where are the exceptions to these rules?
- How can customers be clustered?
“We are 30-35% of the way there and by the end of the year it will become a more robust process. Even tasks such as data cleansing will be a process-driven checklist of 40-45 items,” he shares.


