


 It is said of fishermen that 90% of the fishermen fish where 10% of the fish are. Conversely 10% of the fishermen fish where 90% of the fish are. The moral to this story is that the biggest factor in the success of fishing is to fish in the right place.
The same is true of trying to find business value in data. The best and smartest thing you can do in order to enhance your chances of success in finding business value in data is to pay attention – a lot of attention – to where you are trying to find your business value.
In order to understand how to optimize your chances for success, you need to understand a little bit about data.
Consider ALL corporate data. All corporate data is found in Fig 1.

The diagram in Fig 1 depicts EVERYTHING in terms of data that is found in the corporation.
This diagram is at such a high level that it is almost meaningless. To understand this diagram and its implications, it is necessary to break the diagram apart.
Fig 2 shows that a big part of the diagram depicting corporate data is structured data.

In Fig 2 it is seen that most of the data in the corporation is unstructured data. But there is some structured data in the corporation. For the most part the structured data fits conveniently into standard data base systems. And not coincidentally the structured data relates strongly to corporate transactions – purchases, ATM activities, reservations, and so forth. There is much work and much study that has been done with structured data.
Historically structured data was the first kind of data that was ever computerized.
The vast majority of data found in the corporation is unstructured data.
Fig 3 shows the different kinds of unstructured data.

One way unstructured data can be divided is by textual data, spreadsheet data, and analog data. Textual data is data that consists of text. There are many forms of textual data in the corporation – email, contracts, customer feedback, warranties, and so forth. The second form of unstructured data is spreadsheet data. Spreadsheets have been used in the corporation for years. They are in the domain of the end users. Spreadsheets can be formal or informal, depending on the whim of the end users. The third type of unstructured data is analog data. Analog data is data that is generated automatically. There are many ways to generate data by a machine.
Fig 4 shows that there are different types of analog data.

One form of machine generated data is data generated by machines that manufacture something. Another form of machine generated data is by machines that take electronic images – from satellites, from xray machines, and so forth. Then there is the emerging class of IoT data.
When taken in its totality, corporate data can be redrawn as seen by the diagram in Fig 5.

The diagram of Fig 5 is much more elucidating than the simple figure of corporate data as seen in Fig 1. In Fig 5 it is seen that indeed there is corporate data but that there are very different kinds of corporate data.
There are actually LOTS of implications to the diagram of corporate data as seen in Fig 5. One of those implications is – where do you find business value of data? As it turns out, there are some very significant differences in the places where business value is found.
Fig 6 maps business value to the types of data found in the corporation.
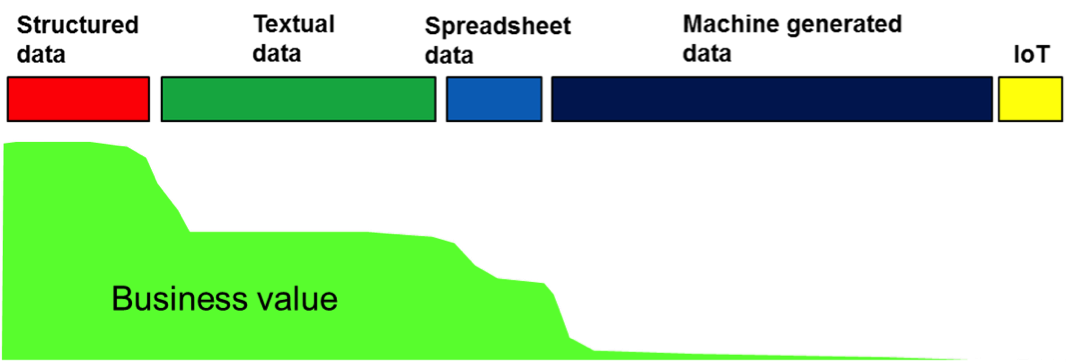
Fig 6 shows that there is great business value in structured data. This is no surprise as businesses have long studied transactions that have transpired in the daily business of the corporation. There is also much business value in the text of the corporation, although corporations are just now waking up to that fact. Likewise there is much business value to be found in the spreadsheets of the corporation. Many corporations run on the informal systems that have been created in the spreadsheet format.
When it comes to machine-generated data there is a little, but not much business value to be found here. And the business value of IoT data is just emerging today.
So what does the diagram shown here have to do with finding business value and fishing in the right place? Fig 7 shows that major investments in data science have been made in looking at machine generated data and to some lesser extent in structured data.

If data scientists were looking strategically, they would find that looking for business value where they ae looking today is a losing proposition. There are much more fertile places to look for business value. There are other waters where there are lots of fish and no one there.


