Getting right content to right people at the right time is essential, which should be unique identity of an analytics division & also be able to handle large scale of data via non-traditional analytic techniques and visualizes it in real time.
The accuracy, integrity and clarity of solutions through Visualization techniques should be a perfect mix of 6W’s (What, When, Where, Why, How & Who) which plays an integral part while connecting to managers for the daily attention and focus.
Let’s dive into few legendary Visualizations
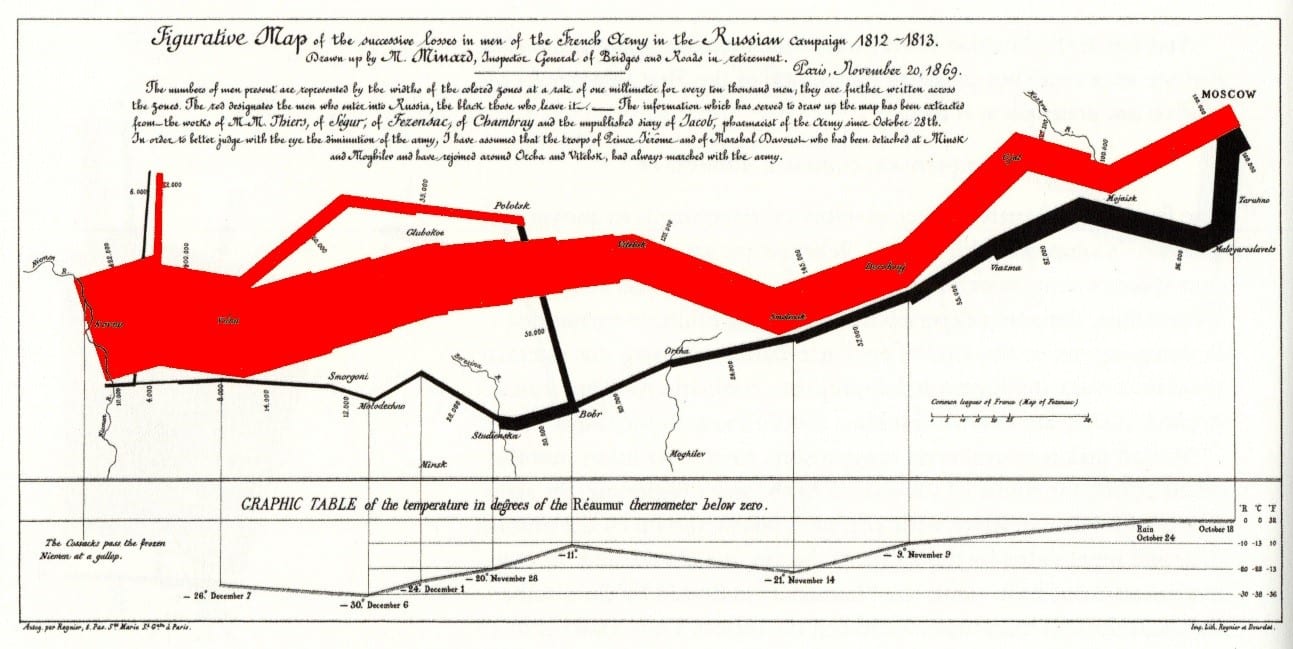
Charles Joseph Minard: Napoleon’s Retreat From Moscow (The Russian Campaign 1812-1813)
- Story of losing soldiers on a journey towards east & while returning how they lost how many soldiers crossing a river, how much soldiers could not survive in cold.
- Temperature, date, and man count are interpolated between the distributed data points. Losses are assumed to occur gradually, counts are assumed to represent the number of men at the beginning of a given leg. Additional data-points were added to adjust the timeline to the battles of Maloyaroslavets, Vyazma, and Berezina.
Move your mouse pointer onto (or tap) the map’s description for a translation — or a French transliteration — of the original text (http://www.masswerk.at/minard/)
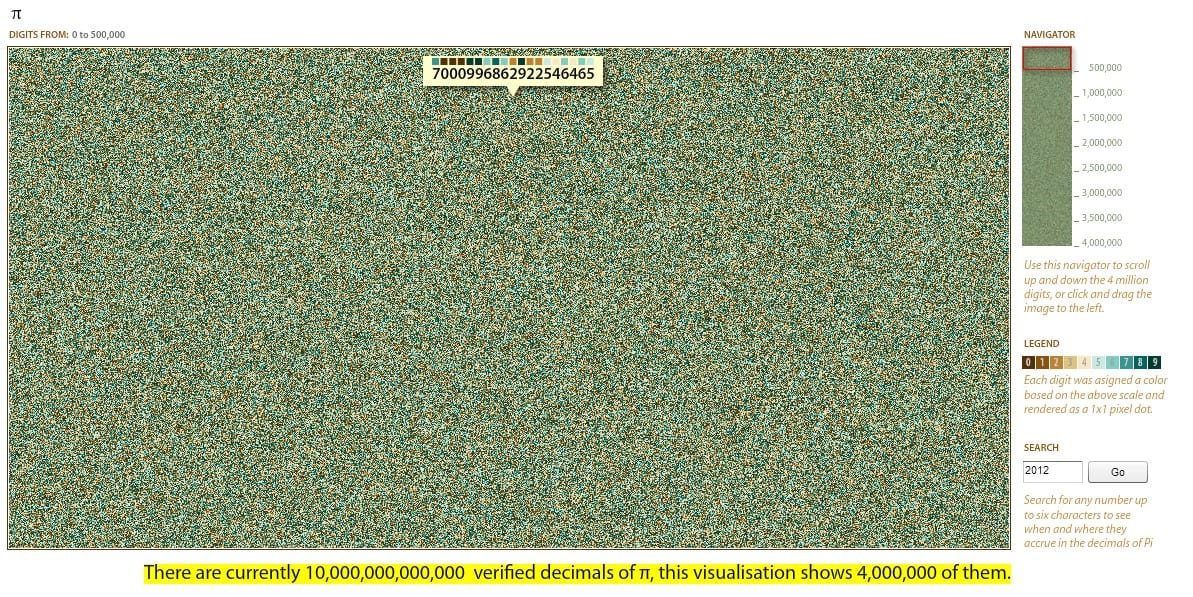
Visualization of PI.
- On October 17, 2011, Shigeru Kondo concluded 371 days of computing 10,000,000,000,000 decimal places of Pi, roughly 44 TB disk was needed to perform the computation, and 7.6 TB of disk was needed to store the compressed output of decimal and hexadecimal digits.
- 10 trillion verified decimals of Pi calculated by a computer, but this visualization shows 40, 00,000 of those. Every single dot represents decimals (Roll over the plane and see the effect) (http://two-n.com/pi/)
Map by Dr. John Snow
- The September 1854 cholera outbreak was centered in the Soho district, close to Snow’s house. Snow mapped the 13 public wells and all the known cholera deaths around Soho, and noted the spatial clustering of cases around one particular water pump on the southwest corner of the intersection of Broad (now Broadwick) Street and Cambridge (now Lexington) Street. He examined water samples from various wells under a microscope, and confirmed the presence of an unknown bacterium in the Broad Street samples. Despite strong skepticism from the local authorities, he had the pump handle removed from the Broad Street pump and the outbreak quickly subsided.
- Dark points shows the deaths and if carefully observed all deaths were concentrated around a water pump.
(https://www.udel.edu/johnmack/frec682/cholera/)

The earliest form of written communication is visual, & are symbolized as the pictures represent the way of communication.
As communication evolved we used to communicate complex ideas through texts, but that has not worked well for numbers. We can easily decode numbers much more easily and quickly by visual form.
Why is that?
- 30-50% of brain devoted to visual processing.
- Around 70% of sensory receptors in analyzing.
- It makes tenth second to make a visual sense, really just at a glance of an eye.
If we have a close look into John Snow and Napoleon’s visualizations we can notice the positive sides of the analog part of storytelling i.e.
- Speed (ideas with pen and paper moves very fast)
- Flexibility (modification with as many experiments possible)
- Scale (Which will not possible in modern era’s small screen like a computer)
- Good body-mind connection (Very comfortable)
All are about brain storming. Point to go for analog is that its natural and it reduces the layers of things between me and my idea. I can move quickly, can generate as much ideas as possible. I can comfortable on it and can’t go wrong easily.
Storytelling
Visualization is just more than data or charts or maps, at their best they are stories. Humans being telling each other, stories as their primary means of communications from tens and thousand years.
As stories have simple structure, you can force audience to follow the linear progressive way rather data’s complex face & you can’t tell about Hollywood or Bollywood in English in the jungles of Amazon. You have to relate to their language and their culture and scope of understanding (most importantly you need to know what they don’t know)
In the end
Why we communicate visually
- Tangibility: We can turn data & numbers into tangible where people can relate to, (charts or illustrations)
- Simplification: Will help you reduce text, help convey information easily and quickly
- Context setting: Visuals can reduce distraction, help to grab attention, really help to establish themes by infographics