— USE CASE: CALCULATE SELLING PRICE OF MY HO– USE
Jim has a 4 bedrooms and 3 bathrooms house in Cupertino, CA, USA. He wants to sell the house and move to Florida. Some friends are telling him that he can get as much as $2.2 Million USD, but Jim’s best friend is telling him that he can only get $1.7 million for 2,769 Sq ft house in Cupertino. Jim is in trouble. That is roughly 1/2 million dollars.
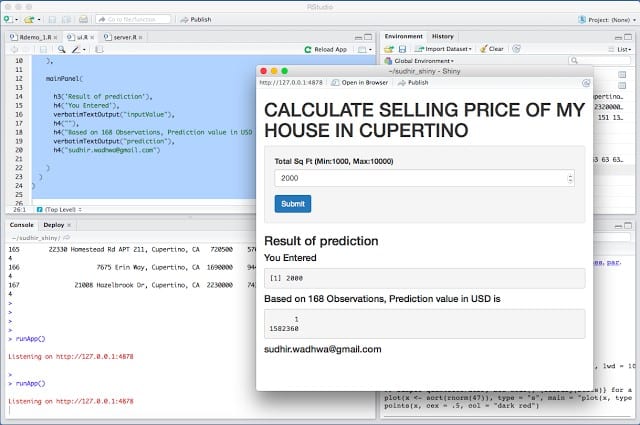
So we asked jim to give it a try : https://sudhirwadhwa.shinyapps.io/sudhir_shiny/
Jim gave an input of 2,769 Sq ft and got suggested sale price should be $2,036,417

First here is the complete code for 2 files: Server. R and ui.R
ui.R
this is UI for the Shiny App
May 26, 2015 , 8 34 PM PST
shinyUI(
pageWithSidebar(
headerPanel (“CALCULATE SELLING PRICE OF MY HO– USE IN CUPERTINO”),
sidebarPanel (
numericInput(‘TotalSqft’, ‘Total Sq Ft (Min:1000, Max:10000)’, 2000 , min=1000, max=9000, step=50),
submitButton(‘Submit’)
),
mainPanel(
h3(‘Result of prediction’),
h4(‘You Entered’),
verbatimTextOutput(“inputValue”),
h4(“”),
h4(“Based on 168 Observations, Prediction value in USD is “),
verbatimTextOutput(“prediction”),
h4(“sudhir.wadhwa@gmail.com”)
)
)
)
server.R
This is Server file for Shiny App
Sudhir.Wadhwa@gmail.com , May 26, 2015 , 8 34 PM PST
pricePredict <- font=”” function=”” otalsqft=””>
trainingdataset_cupertino <- file=”trainingdataset_cupertino.csv” font=”” head=”TRUE,sep=” read.csv=””>
fit1 <- data=”trainingdataset_cupertino)</font” lm=”” totalsqft=””>
pre1<-predict fit1=”” font=”” newdata=”data.frame(TotalSqft)”>
pre1
}
shinyServer (
function(input, output) {
output$inputValue <- font=”” input=”” otalsqft=”” renderprint=””>
output$prediction <- font=”” input=”” otalsqft=”” pricepredict=”” renderprint=””>
}
)
Let’s run this first
using RStudio or R , create these two files ui.R and server.R
and just use runApp()
This will open an App on you local desktop and you can use the App. I will soon show you, how to publish this App using Shiny so others can use it ( without understanding and worrying about R or Shiny)
Now , I will explain how you can write the App step by step:
- Collect the Data Required to build the App. In my case, I created a csv file of 168 houses sold in last one year in Cupertino, CA , 95014 zipcode ( hey if you want to play with my code , you can request for csv file – email me @ sudhir.wadhwa@gmail.com and I will send .csv file)
- Install R. http://cran.r-project.org/bin/macosx/
get R-3.2.0.pkg file
Install the package
- Install R Studio
http://www.rstudio.com/products/rstudio/download/
- Let’s understand the ui.R first
This is the header Panel which will just create a user interface.
headerPanel (“CALCULATE SELLING PRICE OF MY HO– USE IN CUPERTINO”),
sidebarPanel (
numericInput(‘TotalSqft’, ‘Total Sq Ft (Min:1000, Max:10000)’, 2000 , min=1000, max=9000, step=50),
submitButton(‘Submit’)
It sets the by default value of TotalSqft to 2000, min = 1000 , max = 9000 Sqft. It creates a step of 50 for going up and down Total Square foot. It also paints the submit button so user can enter the value of TotalSft
Next comes the Main Panel
h3(‘Result of prediction’),
h4(‘You Entered’),
verbatimTextOutput(“inputValue”),
h4(“”),
h4(“Based on 168 Observations, Prediction value in USD is “),
verbatimTextOutput(“prediction”),
h4(“sudhir.wadhwa@gmail.com”)
h3 and h4 are just html tags to display some text.
Most important commands are verbatimTextOutput(“inputValue”), that gives value to server and verbatimTextOutput(“prediction”), that gets value from the server and display on user interface.
Your ui.R is ready , Its simply giving Total Square foot to Server and Server return the Value. In Jim’s example Total Sqft = 2769 and returned value is $2,036,417
- Now Let’s understand how server.Ris recommending value of $2,036,417 for Jim’s house.
Let’s look at this part of the code first
shinyServer (
function(input, output) {
output$inputValue <- font=”” input=”” otalsqft=”” renderprint=””>
output$prediction <- font=”” input=”” otalsqft=”” pricepredict=”” renderprint=””>
}
)
output$inputValue <- already=”” by=”” input=”” otalsqft=”” provided=”” render=”” renderprint=”” says=”” server=”” span=”” the=”” to=”” totalsqft=”” ui.r=”” was=”” which=””>
output$prediction <- function=”” input=”” nbsp=”” otalsqft=”” output=”” pricepredict=”” render=”” renderprint=”” says=”” span=”” takes=”” the=”” using=”” which=””>TotalSqft as argument
So, the magic recommendation is done by pricePredict function. Let’s study that function next.
pricePredict <- font=”” function=”” otalsqft=””>
trainingdataset_cupertino <- file=”trainingdataset_cupertino.csv” font=”” head=”TRUE,sep=” read.csv=””>
fit1 <- data=”trainingdataset_cupertino)</font” lm=”” totalsqft=””>
pre1<-predict fit1=”” font=”” newdata=”data.frame(TotalSqft)”>
pre1
}
Let’s understand each statement one by one.
trainingdataset_cupertino <- file=”trainingdataset_cupertino.csv” font=”” head=”TRUE,sep=” read.csv=””>
Command is simply saying read the csv file called trainingdataset_cupertino.csv where file has header and field in the file are separated by colon (:).
Now the data frame trainingdataset_cupertino has 168 observation. It should look like this
trainingdataset_cupertino
Address USD PerSqft Beds Baths TotalSqft Date
1 22057 Mcclellan Rd, Cupertino, CA 960000 65 2 2.0 994 3/3/15
2 10227 S Foothill Blvd, Cupertino, CA 1590000 926 4 3.0 1717 3/3/15
3 22067 San Fernando Ct, Cupertino, CA 2300000 1,029 4 3.0 2234 3/3/15
4 20488 Stevens Creek Blvd APT 1318, Cupertino, CA 685000 839 1 1.0 816 3/2/15
5 19999 Stevens Creek Blvd UNIT 307, Cupertino, CA 910000 763 2 2.0 1192 2/27/15
6 20222 Northcove Sq, Cupertino, CA 595000 560 1 1.0 1062 2/27/15
7 10315 Stydale Dr, Cupertino, CA 2320000 924 5 3.0 2510 2/24/15
8 7538 De Foe Dr, Cupertino, CA 1600000 1,264 3 2.0 1265 2/24/15
9 10501 Florence Dr, Cupertino, CA 2800000 1,065 4 3.0 2629 2/20/15
10 21675 Olive Ave, Cupertino, CA 1350000 873 4 3.0 1546 2/20/15
Observe the fields ( features or called predictors) – Address , USD , PerSqft, Beds and Baths , TotalSqft and Date the property was old. I am just showing 10 rows. My dataset actually has 167 observations ( Rows).
- Now you have the trainingdataset_cupertino data frame. Let’s write a simple linear regression model
fit1 <- data=”trainingdataset_cupertino)</b” lm=”” totalsqft=””>
Lets understand the above written command in RStudio
lm = Linear Regression
USD ~ TotalSqft ( y ~ x, USD is depending on TotalSqft , is it ?)
Data is in the data frame trainingdataset_cupertino
( if you want to make linear regression formula more interesting , you can use
USD ~ Beds+ Baths+TotalSqft, but for now , we can just work with TotalSqft)
pre1<-predict fit1=”” font=”” newdata=”data.frame(TotalSqft)”>
That means predict using model = fit1 and newdata = TotalSqft given by the user.
Predict the value using the Machine learning function model fit1
pre1 at the last line returns the predicted value which is $2,036,417 for Jim’s house
Next step, I will show you how to put it on website so others can use this App.
Part 2 coming soon…