This is the third part in a series of articles on Customer Life Stage modelling. The first part defined the term Customer Life Stage Model (you can read it at https://analyticsindiamag.com/part-1-customer-life-cycle-a-misleading-term/ ). The second part attempted to create a 3 dimensional model (you can read it at https://analyticsindiamag.com/part-2-creating-the-customer-life-stage-model/ ). In this part we will use the sample model created in the previous article and will draw up the typical customer life stage path for a client.
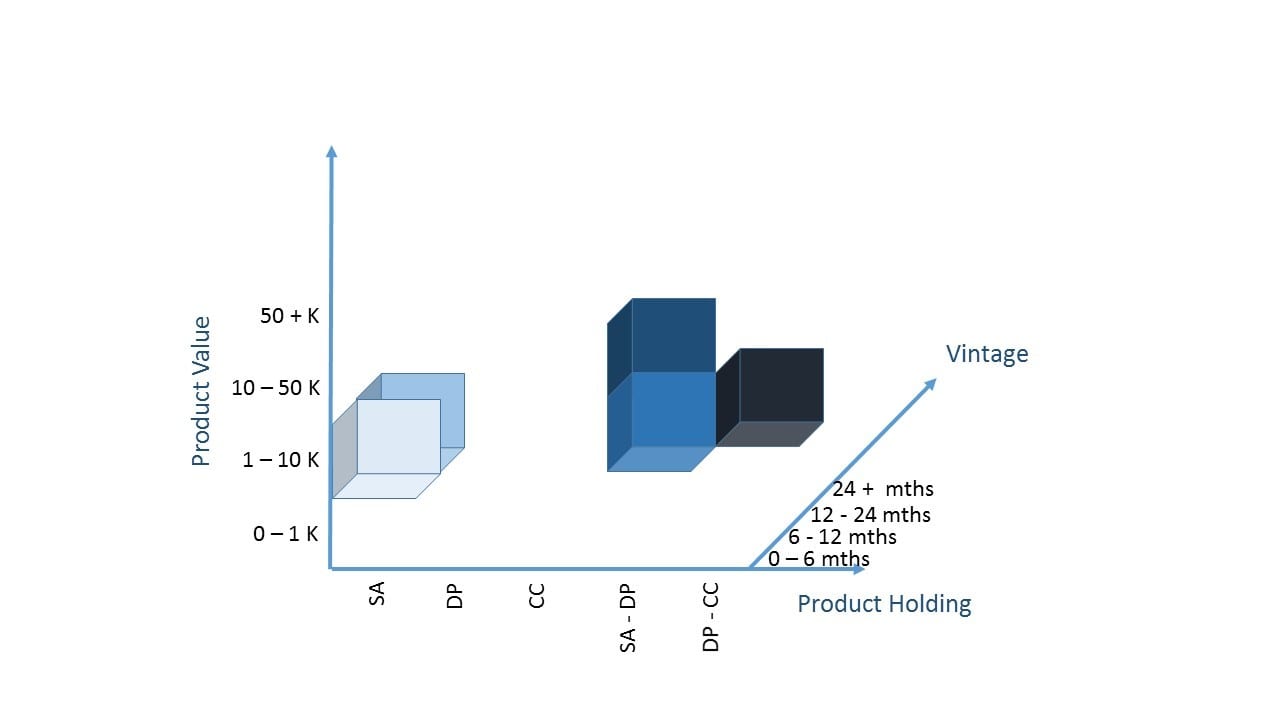
In the example, we consider the scenario for a banking institution. For sake of simplicity, we will label the dimension as A (for Product Holding), B (for Product Value) and C (for Vintage). We will number the cells sequentially from 1 to 5. A cell will be denoted as A#:B#:C#. Thus a cell A1:B2:C1 will denote a customer who has a Savings Account with a balance of Rs. 50,000 which has been opened 2 months back. The bank considers a spread of 4% of the average balance in the savings account as the value of the deposit. So, a Rs. 50,000 deposit gives a product value of Rs. 2,000.
This customer keeps on steadily increasing his savings. Thus, his balance increases over the next 4 months. This moves him to the cell A1:B2:C2 which is the vintage over 6 months. But his balance has not increased to the extent that the product value to the bank is less than Rs. 10,000.
The relationship manager successfully convinces him to move his money in a term deposit and thereby generate higher interest. Since, the customer now holds two products, he moves into the cell A4:B2:C2.
Over the next 12 months, he keeps steadily increasing his savings and moving the excess money to fixed deposits. Thus, he moves into A4:B3:C3 within the period of 2 years.
Now, the customer has enough money to invest and he withdraws a significant amount for his procurement. This drops the product holding value to the bank for this customer and gets him into the cell A4:B2:C4.
Over a period of two years the customer has moved across five cells or life stages in the customer relationship. This path can be denoted as A1:B2:C1 -> A1:B2:C2 -> A4:B2:C2 -> A4:B3:C3 -> A4:B2:C4.
Another customer, over his 2 year relationship, is likely to establish a different life stage path. Thus, for a bank having, say, a million customers, there is likely to be many combinations or life stage paths having different sequence of cells in each path. Some customers may exhibit the same path and other different.
Our challenge at this time is to find the most frequented combination of cells forming a full customer life stage path or a part of it. We go back to the sequence analysis to do this. We consider the life stage followed by each customer over a two year period of relationship with the bank. Applying the sequence analysis, we will get the most frequented path or paths in this life stage model.
We could also take a objective based approach to sequence analysis. Say the bank loves to have customers holding liability products with the bank and giving a high value of return. So the most favoured cell is A4:B4:C4. We look at all those customers who eventually landed up in this cells and then calculate the path taken by each to arrive at the desired cell. Thereafter, using sequence analysis we find the most commonly traversed paths to reach the desired cell.
This article aimed at arriving at the most commonly traversed customer life stage paths. The next article will delve deeper into each stage and define the events linked to each cell.
For more details on sequence analysis, go to http://en.wikipedia.org/wiki/Sequence_mining.