Business people often expect that the analytics system will take the decision and they just need to act on it. The analytics team creates models that generate a score indicating the likelihood for a certain event. They expect the business team to accept this output for taking some preferential action. Business teams push back on this. Eventually, under compulsion, the analytics teams provides a flag for the predicted event for each entity.
Let me explain this with an example. The churn prediction model will provide a score for the likelihood of the customer terminating this account. But business team often push back from accepting this output stating that they want a list of customers who will churn so they can initiate proactive retention activities on them. The analytics team would then take a call on the score cutoff that defines a churned customer and thereby generate the list required by business. So when the list is not accurate, the business team is quick to blame the analytical process as a failure.
This is where the flaw lies. The responsibility of the analytics activity is to generate the most appropriate score and rank the customer on the likelihood of the churn happening. The selection of the cut-off score is a decision of the business team. And there is a quantitative method to arriving at this cut-off. This is known by various terms – cost matrix, mis-classification matrix or type I / II error matrix.
Consider a churn scoring of 10 customers. The following table gives the scores and the actual event of whether the customer eventually churned or not.
| Identifier | Churn Score | Actual Churn (1 = churned) |
| Customer01 | 100 | 1 |
| Customer02 | 90 | 1 |
| Customer03 | 80 | 0 |
| Customer04 | 70 | 1 |
| Customer05 | 60 | 1 |
| Customer06 | 50 | 0 |
| Customer07 | 40 | 0 |
| Customer08 | 30 | 1 |
| Customer09 | 20 | 0 |
| Customer10 | 10 | 0 |
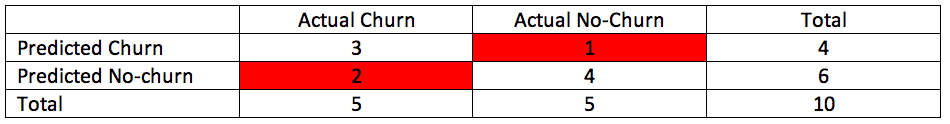
The mis-classification matrix aims at comparing the accuracy of the predicted decision. But this is dependent on the cut-off score. Let us say, this cutoff was decided as 50. That is, any customer with a score higher than 50 is likely to churn. In the above list, customers 01 thru 05 will be labelled as predicted churners. Based on this, the mis-classification matrix will be as follows:

The cells in red show the error in judgement, or the mis-classification. In this case, where the cutoff is 50, the mis-classification is 2 out of 10 cases, so 20%. Now if we take the cutoff score as 60, the matrix would look as follows:
In this case, the mis-classification is 30%. It is evident that the selection of the cutoff score is critical to evaluate the accuracy of a model. This is the decision that the business team has to make. The cost matrix is the model available to assist the business team in this decision.
The cost matrix calculates the cost of activities implemented as a result of the analytical model. In the mis-classification matrix, there are two types of misclassification. One is where the analysis predicted that the customer will churn and the customer did not churn. The other is where the analysis predicted that the customer will not churn and the customer did churn. The second type of misclassification is critical to business and is known as Type I error and the other is known as Type II error. It should be noted that both these types of error will always exists and they limit the other. That is, decreasing one will increase the other. The reader can try this using different values of cut off score.
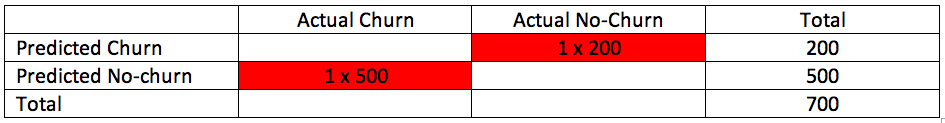
The cost matrix puts a cost to each of the matrix cells. The cost is the loss to the business from each mis-classification. When the customer is tagged as a churner, the business initiates retention activities. Lets say this activity costs Rs. 200 per customer. A churned customer results in loss of Rs. 500 of potential revenue.
So now we have the type II error, which states the customer will churn but did not. However, since the model predicted a churn, the business spent the money on retention activities. Thus, the business spent Rs. 200 on each customer who would not churn. This is cost of Type II error per customer. On the other side, in Type I error, the model stated the customer will not churn, so the business did not initiate the retention activities and the customer actually churned. This decision cost the business Rs. 500 of potential revenue per type I error.
Now we calculate the cost of decision on the earlier two scenarios.
Cost Matrix where the cutoff score was 50:
Cost Matrix where cutoff score was 60:

The cost of the decision in the first scenario, cutoff score = 50, is lower. Hence, between these two scenarios, the first scenario is better. So cutoff score should be 50.
We could try this exercise with different values of the cutoff score and select the one where the cost matrix is the lowest.
The key assumption in this exercise is the cost of Type I and Type II error. This is the call that business needs to take. The analytics team can provide the cost of decision basis various cut off scores. But they should not take the call on the Type I or Type II error costs.
It is very important to make the business team understand this and take ownership of the decisions on costs. It also helps in calculating the ROI of the model and deciding if the model is beneficial or not. The judgement of the customer on the predicted event is not for the analytics team to make.