

ARIMA is the most popular model used for time series analysis and forecasting. Despite being so popular among the community, it has certain limitations as well. There are a few conditions where the ARIMA model has difficulties in dealing with the time-series data. In this article, we will highlight those limitations of the model where it has difficulties. The major points to be discussed in the article are listed below.
Table of contents
- The ARIMA model?
- Conditions when ARIMA can be avoided
- With stationary data
- With multivariate data
- Need of explainability
- Computational constraints
- Continuity of the data
Before understanding its limitations, let’s first start with understanding the ARIMA model in brief.
The ARIMA model?
The ARIMA model is a short form of the autoregressive integrated moving average. As the name suggests, this model combines three different techniques: autoregression, integration (differencing), and moving average. These components make the model work using three parameters denoted by (p, q, and d). We can also think of this model as the generalization of the autoregressive moving average (ARMA) model.
These models can be utilized to make predictions based on the sequential data mostly with the time series data. The autoregressive (p parameter) part of the model means that the variable which going to be modelled is regressed on its own lagged values, the integrated (d parameter) part of the model means the time series differencing and the moving average part (q parameter) of the model means the regression error.
There is always a requirement to find out the values of parameters to model the time series accurately. One of the best ways to find out the values of the parameters is to start with differencing the time series. Perform the differencing once and after that, the time series get stationary using the autocorrelation function (ACF) and a partial autocorrelation function (PACF) plots. The PACF plot gives the p parameter that is a cut-off point on the PACF and the ACF plot gives the q parameter that is the cut-off point on the ACF plot. Let’s take a look at the below image.

In the above image, we can see an example of an ACF plot and we can see that around at 3rd value of the x-axis we have got the cut-off value so the value of the q-parameter will be 3 because it is cutting the p-value axis till the second value. Similarly, we can find the value of p using the PACF plot. In one of our articles, we can get an idea of plotting the ACF and PACF plots.
Although this model is one of the most important models from the time series analysis that can be used in understanding and making forecasts from the time series. This model also has some shortcomings. These shortcomings make it difficult and inaccurate to use in time series modelling procedures. In one of our articles, we can get the whole guide to using the ARIMA model in our projects. In this article, we are focused on the points that can tell us when not to use the ARIMA model. So let’s move toward those points.
Are you looking for a complete repository of Python libraries used in data science, check out here.
Conditions when ARIMA Should be avoided
Some of the points that can tell us when not to use the ARIMA model are as follows
With non-stationary data
One of the most important factors that we need to consider while applying the ARIMA model in the time series is that the data we are using should not be stationary. In such a situation we are required to use other models like ARMA. The stationarity of the data can be checked using the Augmented Dickey-Fuller test in which if the p-value is more than the significance level then we consider time series data as nonstationary and if it is not then the time series is stationary.
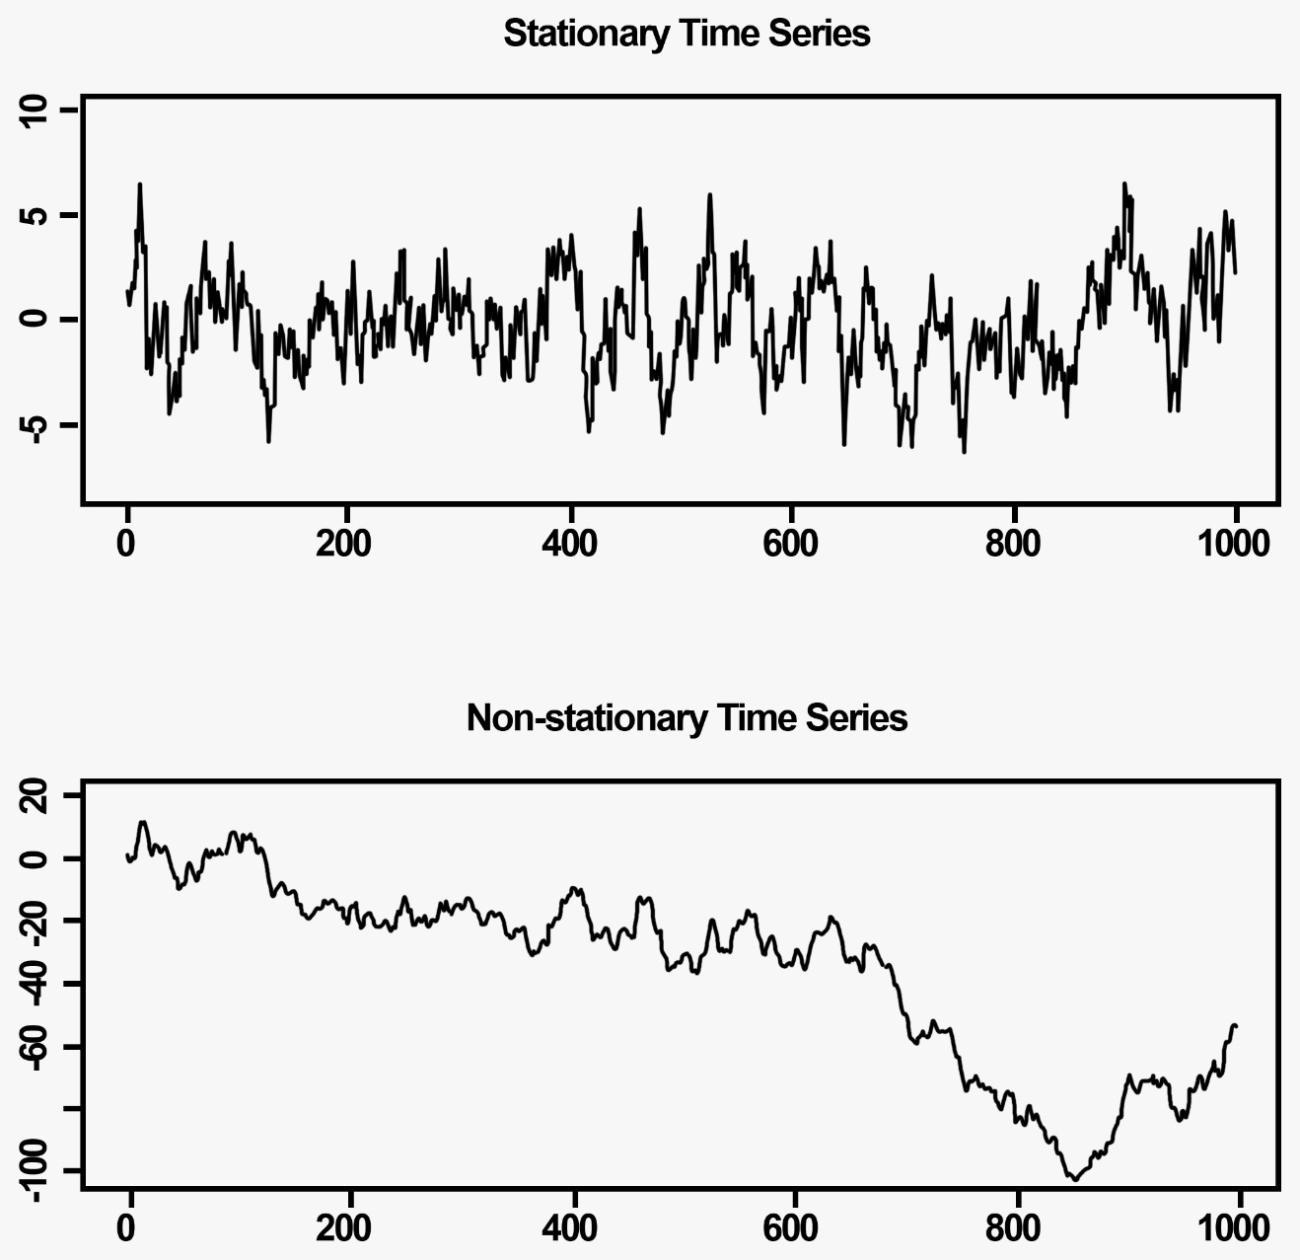
(An example of stationary and non-stationary time series, Source: O’Reilly)
We should apply this model after knowing about the stationarity of the time series. The reason behind applying with non-stationary data is the integration part of the model that applies the differencing step and with stationary data, ARIMA can not be applied. By the differencing, the model makes the time series stationary.
With multivariate data
The ARIMA model is designed to use the univariate time series data so if the time series is having only one variable we can use it otherwise we are required to choose models from the VARMA family. However, we can perform modelling using the variables one by one manner but if the correlation is there between the variables of the time series then we can not use it to make proper results.
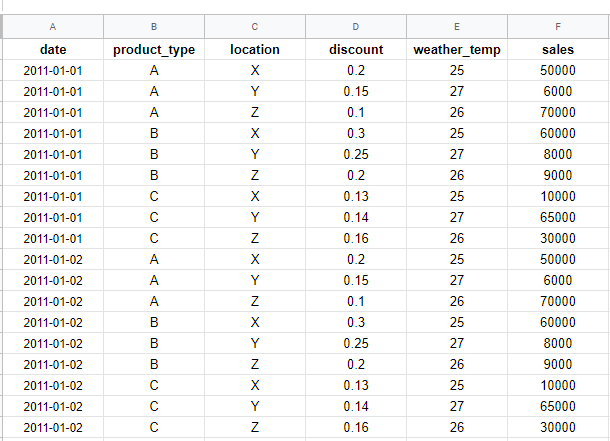
(Example of multivariate time series data. Image Source)
Need of Explainability
If we need explainability in modelling we should not use the ARIMA model because its nature is not very explainable. In such situations, we can choose models like exponential smoothing, moving average (MA) etc. the reason behind the less explainability is the combination of three modelling procedures makes it difficult to interpret models with higher values.
Computational constraints
With very long time series this model becomes very expensive and slow in computation. The reason for being weak at computation is the moving average and integration part of the model because applying differencing more than once is also a high computational process and the moving average is the linear combination of the errors. Also sometimes they can perform poorly if we don’t have prior knowledge about choosing the right value of parameters.
Continuity of the data
With the ARIMA model, it becomes compulsory to record data points in a regular time interval. If there are missing values in the time series then this model can not be applied to the time series. The reason behind this problem is we are applying a moving average which moves the window through the time series and finds the trend of the time series. If the trend is broken at a point, it stops working and can cause the models to not perform.
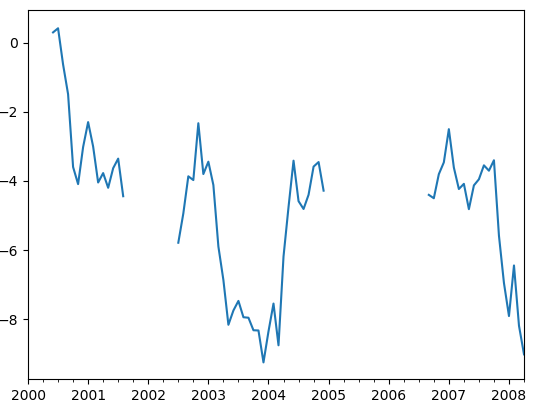
(Example of time-series data with missing values)
We can also see that sometimes there is a poor performance of the ARIMA if the time series has some turning points because using the moving average model generalizes the values of the turning points and becomes unable to keep the information of turning points.
Final words
In this article, we have discussed the ARIMA model, one of the most popular models for time series forecasting. However, ARIMA remains the first choice of practitioners in time series analysis, it has certain limitations as well. Through this article, we highlighted the gray areas where the application of the ARIMA model should be avoided.