Classification and regression models are very helpful in completing almost every aspect of data science and both of them are very different from each other. Even the type of data these methods use is also very different. The difficulty occurs when the data we get is neither purely categorical nor purely regressive. In such a situation, ordinal regression is a method of modelling that comes into the picture to save us. Ordinal regression can be considered as an intermediate process of regression and classification. In this article, we are going to discuss ordinal regression. The major points to be discussed in the article are listed below.
Table of contents
- What is ordinal regression?
- How to implement ordinal regression?
- Data loading
- Data preprocessing
- Fitting Ordinal regression
- Ordered probit model
- Ordered logit regression
- When to use ordinal regression?
First, let’s discuss what ordinal regression is.
What is ordinal regression?
In statistics and machine learning, ordinal regression is a variant of regression models that normally gets utilized when the data has an ordinal variable. Ordinal variable means a type of variable where the values inside the variable are categorical but in order. We can also find the name of ordinal regression as an ordinal classification because it can be considered a problem between regression and classification.
We can categorize the ordinal regression into two categories:
- Ordered logit model: We can also call this model an ordered logistic model that works for ordinal dependent variables and a pure regression model. For example, we have reviews of any questionnaire about any product as bad, good, nice, and excellent on a survey and we want to analyze how well these responses can be predicted for the next product. If questions are quantitative then we can use this model. We can think of it as an extension of logistic regression that allows more than two response categories that are in an ordered way.
- Ordered probit model: We can consider this model as a variant of the probit model, it is with an ordinal dependent variable where we can have more than two outcomes. An ordinal dependent variable can be defined as a variable in which the values have a natural ordering, for example bad, good, nice, excellent.
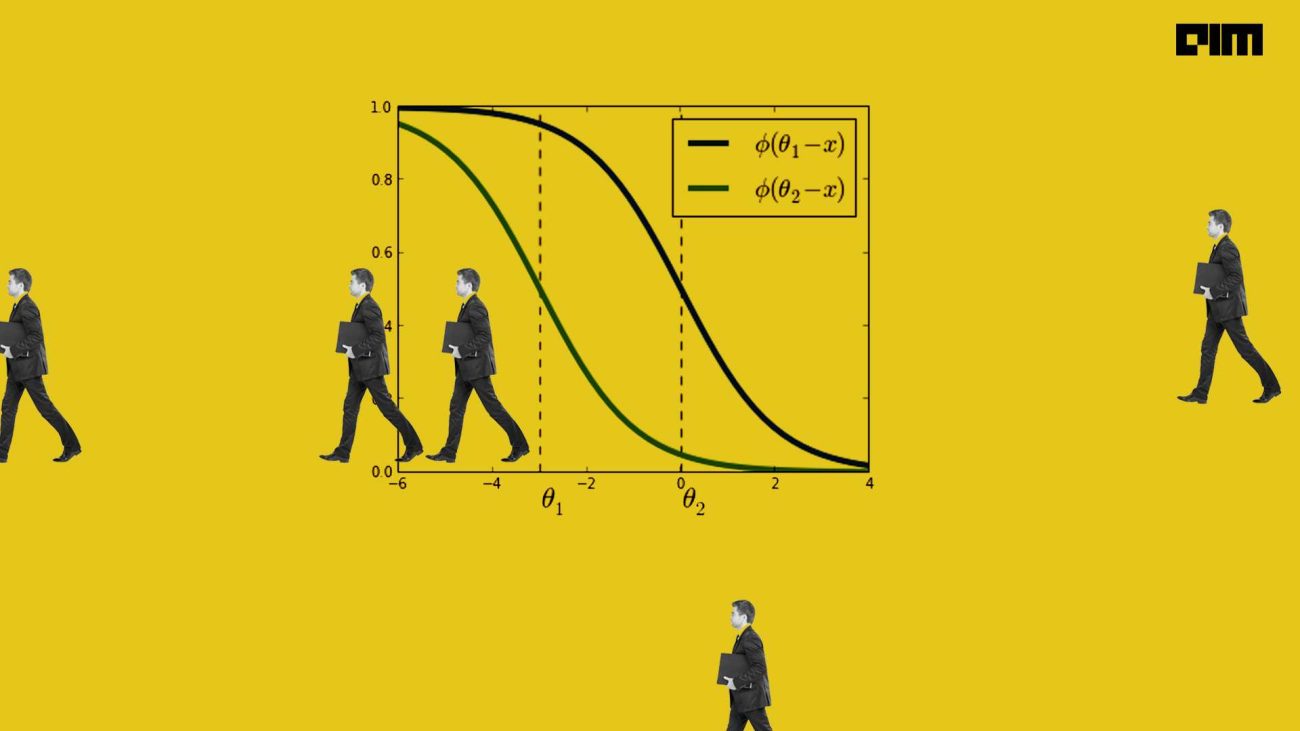
To perform ordinal regression we can use a generalized linear model(GLM). GLM has the capability of fitting a coefficient vector and a set of thresholds to data. Let’s say in a data set we have observations, represented by length-p vectors X1 through Xn, and against these observations, we have responses Y1 through Yn, in the responses each variable is an ordinal variable. We can think of Y as a nondecreasing vector and apply the length-p coefficient vector and set of thresholds. A set of thresholds is responsible for dividing the real number line into segments, corresponding to the response levels that are similar to the numbers of segments.
Mathematically we can represent this model as
Pr(y i|x) = (i – w.x)
Where,
= inverse link function
w = length-p coefficient vector
= set of thresholds with property θ1 < θ2 < … < θK−1.
How to Implement ordinal regression?
In this section, we will discuss how we can implement ordinal regression in the python programming language. For this purpose, we find the library statsmodel very useful that provides functions to implement ordinal regression models very easily. We can install this library in the environment using the following lines of codes
!pip uninstall statsmodels
After installation, we can find the models for ordinal regression under the miscmodels package of the library.
Data loading
In this article, we are going to use a data named diamond data. You can find this data here. In the data set, we have a variable that has an ordinal dependent variable with some categories in an ordered form. Let’s call the data.
import pandas as pd
data_diam = pd.read_csv('diamonds.csv')
Let’s check some data points.
data_diam.head(10)
Output:

In the above output, we can see that there is a variable named cut telling about the condition of the diamond in an ordinary way. That means there are categories Ideal, premium, good, very good, and fair that represent how good the diamond is. Let’s check the data type of variable.
data_diam.dtypes
Output:

Data preprocessing
Here we can see that we have three variables in the object form and in this article we are dealing with the cut variable. To work with the ordinal models from statsmodel we are required to convert this target variable into a categorical ordered form that can be done using the following lines of codes:
from pandas.api.types import CategoricalDtype
cat_type = CategoricalDtype(categories=['Fair', 'Good', 'Ideal', 'Very Good', 'Premium'], ordered=True)
data_diam["cut"] = data_diam["cut"].astype(cat_type)
Let’s check the data type again.
data_diam['cut'].dtype
Output:

Here we can see that now the values under the cut variable are in a categorical ordered form.
Now in the data, we have variables X, Y, and Z that represent the height, width, and depth of the diamond. By multiplying them we can calculate the volume of the diamonds. Let’s calculate the volume.
data_diam['volume'] = data_diam['x']*data_diam['y']*data_diam['z']
data_diam.drop(['x','y','z'],axis=1,inplace=True)
Here we have multiplied the columns X, Y, and Z and dropped them from the data. Let’s plot the data to know about the distribution.
import matplotlib.pyplot as plt

plt.figure(figsize=[24,24])

plt.subplot(221)
plt.hist(data_diam['carat'],bins=20,color='b')
plt.xlabel('Weight')
plt.title('Distribution by Weight')

plt.subplot(222)
plt.hist(data_diam['depth'],bins=20,color='r')
plt.xlabel('Diamond Depth')
plt.title('Distribution by Depth')

plt.subplot(223)
plt.hist(data_diam['price'],bins=20,color='g')
plt.xlabel('Price')
plt.title('Distribution by Price')

plt.subplot(224)
plt.hist(data_diam['volume'],bins=20,color='m')
plt.xlabel('Volume')
plt.title('Distribution by Volume')
Output:

Here we can see the distribution of the weights, depth, price, and volume.
Fitting Ordinal regression
After this data preprocessing and checking the data we are ready to model the data using the models given by the statsmodels. In the earlier part of the article, we have discussed that there are two types of ordinal regression models one is the Ordered probit model and another one is the Ordered logit model. This section will showcase how we can fit our data in both kinds of ordinal regression models.
Ordered probit model
from statsmodels.miscmodels.ordinal_model import OrderedModel
mod_prob = OrderedModel(data_diam['cut'],
                        data_diam[['volume', 'price', 'carat']],
                        distr='probit')
In the above lines of codes, we have called the OrderedModel module that holds the function for the ordinal regression and instantiates an Ordered probit model while taking the cut variable as our target and volume, price, and carat as independent variables.
We can fit and check the summary of the model using the following lines of codes:
res_prob = mod_prob.fit(method='bfgs')
res_prob.summary()
Output:

Here we can see various measures that help in evaluating the model that we have fitted.
Ordered logit regression
Codes for this model are also similar to the above codes except for one thing we need to change is the parameter distr. In the above, we can see it is set as probit and needs to change in logit.
mod_prob = OrderedModel(data_diam['cut'],
                        data_diam[['volume', 'price', 'carat']],
                        distr='logit')

res_log = mod_prob.fit(method='bfgs')
res_log.summary()
Output:

Now we can make the prediction from the model.
predicted = res_log.model.predict(res_log.params, exog=data_diam[['volume', 'price', 'carat']])
predicted
Output:

Here we can see the predictions from the model. These predictions are just a fraction of the correct choice. Now let’s see when we require the use of ordinal regression.
When to use ordinal regression?
There can be a variety of fields like marketing, medical, finance, etc where we may find the usage of ordinal regression. In simple words whenever we get data with categorical values in an ordered format we can find out what are the factors that are affecting the ordered categorical values using the ordinal data.
In the above, we have seen that we had diamonds of four categories and these categories were ordinal but to define a diamond of a category there were three-four factors: weight, price, and volume. To optimize the influence of the factors on the category of diamond we used ordinal regression. So in the final notes, we can say whenever data has ordinal categorical values in a variable and influencing factors in other variables we can use the ordinal regression to get an estimation of the influence of the factors on ordinal categorical values.
Final words
In the article, we have discussed ordinal regression which is a variant of regression modelling that helps in dealing with categorical ordinal values. Along with this we also looked at the implementation of ordinal regression models and discussed when we may require to use ordinal regression models.


