


Finding the best values of a machine learning model’s hyperparameters is important in order to build an efficient predictive model. In time-series modelling also, finding optimal values of the hyperparameters of a model is necessary for accurate forecasting. Grid search is a popular technique for such purposes. In this article, we will discuss how to use the grid search technique with a VARMA model in time series modelling for multivariate time series analysis. The major points that we will discuss here are listed below.
Table of Contents
- What is Grid Search?
- What is VARMA?
- VARMA with Grid Search
- Implementing VARMA with Grid Search
What is Grid Search?
In machine learning, most of the models like the random forest, decision trees, and support vector machines include parameters in their algorithm which are required to be set on different positions so that the model can perform better according to the data. The parameters under the model algorithm can be integer, float, or boolean type, and finding a set of parameters that can be utilized for making the model perform better than the other becomes a task of modelling. In such a scenario the grid search comes into the picture which can be used for finding a set of parameters by iterating on different sets of parameters by the time of making models.
We can define the grid search as the process of performing hyperparameter tuning so that we can determine an optimal set of parameters for a given model like random forest and decision tree. The example of parameters can be the number of trees in the forest, criterion(“Gini”, “entropy”) and the maximum depth, etc. there is always mathematics behind the algorithm of any model and the parameters are the values that make the mathematics to work according to the task given to the algorithm.
When we talk about the working of the grid search it works on predefined values which are assigned for the parameters and help us to find the best fit set of parameters for a given model and data. Let’s say that we have defined a dictionary with some value under it. These values consist of mentioned parameters along with the values the parameter can take.
For example:
 { 'C': [0.1, 1, 10, 100],
   'gamma': [1, 0.1, 0.01, 0.001],
   'kernel': ['rbf',’linear’,'sigmoid']  }
In this example, c, gamma, and kernels are parameters, and values are assigned to the parameters. So when we apply the grid-search with the dictionary on the model it will try all the combinations of the values passed and evaluate the model on the data using all combinations. Lastly, we will gel the metrics like accuracy and loss for every combination so that we can choose which set of parameters is an optimal set of parameters for the model.
In this article, we will see that how can we use the grid search on the VARMA model which is a time series model and we use it for time series analysis when the time series given for forecasting is multivariate before going on the implementation we are required to have a formal discussion on the VARMA model.
What is VARMA?
In time series analysis we see many of the models like AR, ARIMA, VAR, etc. similarly the VARMA model is a time series model, where the full form of the model is Vector Auto-Regressive Moving Average specially used in cases where the time series is multivariate and the meaning of the multivariate time series is the time series where the future values of the time series depend on the multiple variables.
When we talk about the VARMA model we can say that it is a combination of VAR(Vector Auto-Regressive) and VMA(vector moving Average) models. VAR and VMA models can also be used for multivariate time series modelling. Where VAR models can be considered as the generalization of the AR(auto Regressive) models where we assume that the time series is stationary and the p-value which stands for lag order is used for modelling.
The VMA model is a generalization of the Moving Average model where again the time series is stationary but q values which stand for order of moving average are used for modelling. So if we combine the VAR and VMA it becomes a VARMA model where both lag order and order of moving average (p and q) is used in the modelling and also we can convert the VARMA model in VAR by setting the moving average as zero and in VMA by setting the lag order as zero in the modelling. To know more about the VARMA model reader can go through this link.
VARMA with Grid Search
The main focus of the article is to implement a VARMA model using the Grid search approach. Where the work of grid search is to find the best-fit parameters for a time-series model. As we can understand, manually searching for the best fit set of parameters for a model becomes time taking and costly. We can use the grid search and in time series if we talk about the parameters we have the following parameters.
- p: Stands for the number of lag observations included in the model, also known as the lag order.
- d: The number of times the raw observations are differentiated, also called the degree of difference.
- q: Is the size of the moving average window and also called the order of moving average.
So our major aim in this article is to find the best fit set of parameters for a VARMA model using the Grid search method. Let’s start with the implementation of the procedure. To reduce the size of the article I am not posting the codes in the article. For the codes, we can go through this Google Colab notebook.
Implementing VARMA with Grid Search
For this modelling procedure, we require a multivariate time series. Dow_jones_Industrial_average data is a multivariate time series where we have an opening, closing, and high and low information of the shares of the Dow Jones industries. You can find similar data using this link.
The below image represents the details about the data as:
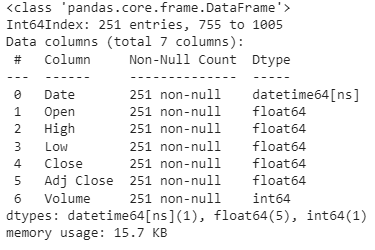

Here in the above images, we can see information about the time series. Before going to the modelling we are required to perform some mandatory tasks such as checking for the stationarity of the data. We can use the Dickey-Fuller test for checking the stationarity of the time series. since in a multivariate time series, we have multiple time series we are checking the stationarity for every time series.


In the results of the dickey fuller test, we measure the p-value. If the p-value is more than 0.02 we can consider the time series as the non-stationary time series.
As we have discussed, the major requirement of modelling a VAR model is a stationary time series. Also, we can make the time series stationary using the following method.
- Detrending
- Seasonal adjustment
- Transformation
We can apply the differencing method from the transformation methods to make the time series stationary. In this article, we used a similar differencing method for making the time series stationary,
Below are the results of the Dickey-Fuller test after applying the differencing method on the time series.


We can see now that the time series we are using for modelling is stationary. Next we are required to know about the correlation between the time series in our time series so that we can model more accurately by understanding the effect of time series on each other.

Here we can see the correlation between the time series and now we can make a dictionary of parameters for grid search as shown above. The parameters in the varma models are p, q and d.

The above-given image is a representation of the different combinations of parameters that we are going to apply for modelling and will find the best-fit combination of parameters for modelling a VARMA model.
We can find an optimal set of parameters by checking the RMSE score after fitting them into the model. The lower RMSE represents the best result. Let’s take a look at the below image.

In this image, I have sorted the data frame according to the lowest RMSE and we can see over here that the best-fit combination of the parameters is (p = 3, q = 3, tr = n) because it gives the least RMSE values.
Now we can fit these parameters on the model and predict the values. The below image is the evaluation metrics for every time series in the multivariate time series.

Here the below graphs are representations of the quality of the predictions which we have made using the model.


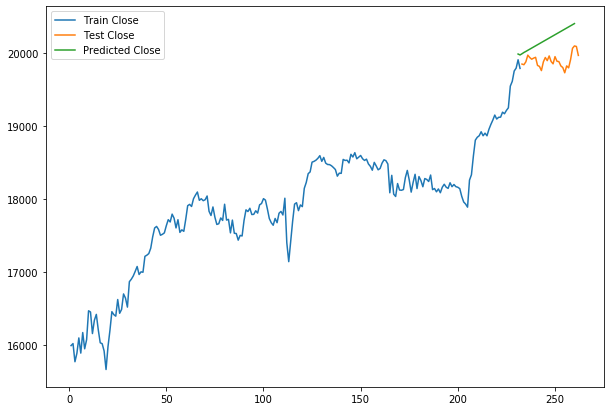
Here we can see that the model is working fine. We have predictions that are almost near to the real values presented in the test data.
Final Words
Here in the article, we have got an overview of the grid search and VARMA models. Along with this, we have also seen how we can use the grid search in the VARMA model that is a time series model. We understood how to find the optimal parameters for a time series model using this approach.


