|
Listen to this story
|
The loss functions are a measure of a machine learning model’s accuracy in predicting the predicted outcome. The cost function and loss function both relate to the same thing: the training process that employs backpropagation to reduce the difference between the actual and anticipated outcome. The log loss function measures the cross entropy of the error between two probability distributions. This article will be focused on learning about the log loss function. Following are the topics to be covered.
Table of contents
- What is a loss function?
- What is log loss?
- Mathematical explanation
The log loss function comes under the framework of maximum likelihood. Let’s talk start by talking about loss function.
What is a loss function?
The term ‘Loss’ refers to the penalty for failing to meet the projected output. If the divergence between the predicted and expected values by our model is great, the loss function generates a larger number; if the variance is minor and much closer to the expected value, it outputs a lower number.
A loss function converts a theoretical assertion into a practical proposition. Building a highly accurate predictor necessitates continuous issue iteration through asking, modelling the problem with the selected technique, and testing.
The only criterion used to evaluate a statistical model is its performance – how accurate the model’s judgments are. This necessitates the development of a method for determining how distant a specific iteration of the model is from the real values. This is when loss functions come into the equation.
Loss functions compute the distance between an estimated value and its real value. A loss function connects decisions to their costs. Loss functions fluctuate depending on the work at hand and the aim to be achieved.
Are you looking for a complete repository of Python libraries used in data science, check out here.
What is log loss?
When modelling a classification in which input variables need to be labelled according to different classes, the task can be represented as predicting the likelihood of belonging to each class. The model will predict probabilities given the training data based on the weights in the training dataset, and the model will adjust its weights to minimize the difference between its predicted probabilities and the training data’s distribution of probabilities. This calculation is called cross-entropy.
The phrase “cross-entropy” is sometimes used to refer to the negative log-likelihood of a Bernoulli or softmax distribution, although this is incorrect. It is possible to define a loss as a cross-entropy between an empirical distribution derived from the training set and a probability distribution derived from the model when it is characterized by a negative log-likelihood. Mean squared error, for example, is the cross-entropy between an empirical distribution and a Gaussian model.
Whenever the concept of maximum likelihood estimation is utilized by the algorithm the loss function is a cross-entropy loss function. When modifying model weights during training, the cross-entropy loss is utilised. The goal is to minimise the loss, which means that the smaller the loss, the better the model. The cross-entropy loss of a perfect model is zero.
Mathematical explanation
Consider a loss function for a binary classification issue as an example. The aim is to anticipate a binary label (y) and the expected probability (p) of 1. A loss function, which is a binary cross-entropy function, is used to assess prediction quality (log loss). The loss function appears to be a function of prediction and binary labels. A prediction algorithm suffers a loss when it produces a forecast when the real label is either 0 or 1.
The formula,

Where,
- y is the label (0 and 1 for binary)
- p(y) is the predicted probability of the data point being 1 for all N points.
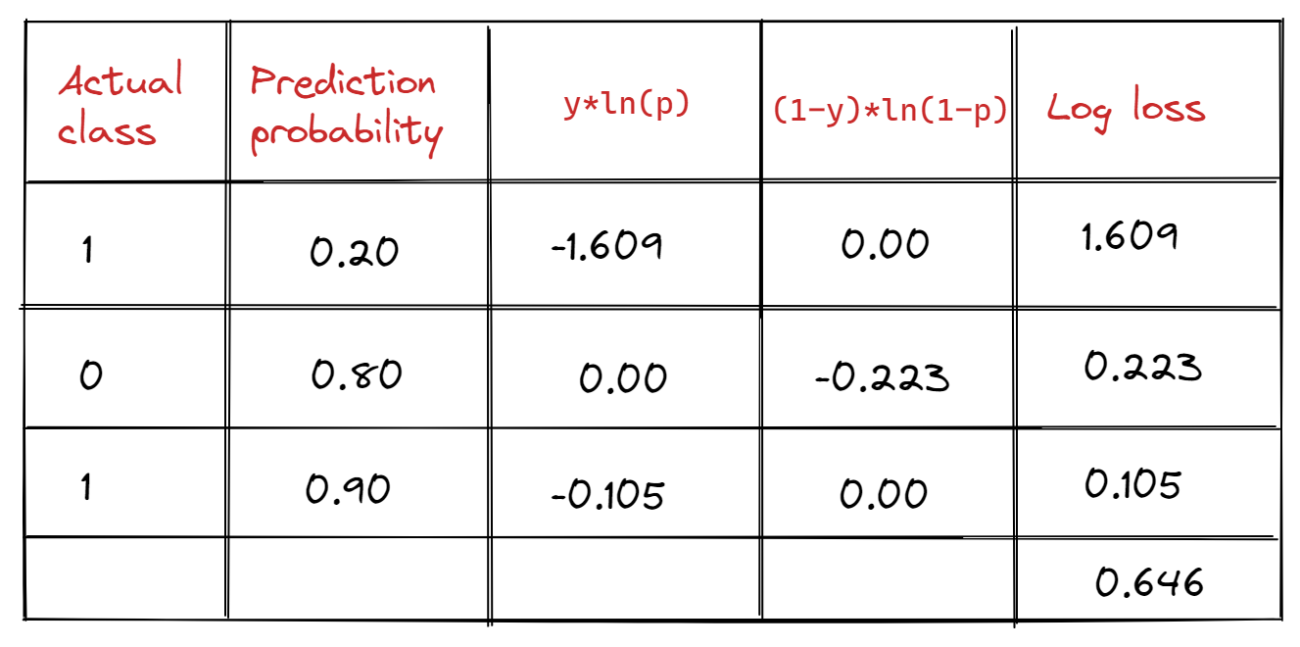
For each observation, the log-loss value is determined using the observation’s actual value (y) and forecast probability (p). A log-loss score of the classification model is presented as the average of log losses of all observations/predictions in order to evaluate and characterise its performance. The average of the log-loss values of the three forecasts is 0.646, as seen in the table.
The log-loss score of a model with perfect competence is 0. In other words, the model forecasts the likelihood of each observation as the actual value. If both models are applied to the same distribution of the dataset, a model with a lower log-loss score outperforms one with a higher log-loss score. The log-loss scores of two models run on two distinct datasets are incomparable.
If the probability of prediction is set at a certain level the lowest log loss score will be set as a baseline score. In the image which is the local minima. The naive classification model, which simply pegs all observations with a constant probability equal to the percentage of data containing class 1 observations, determines the baseline log-loss score for a dataset. A naive model with a constant probability of 0.25 on a balanced dataset with a 49:51 ratio of class 0 to class 1 will provide a log-loss score of 0.326, which is considered the baseline score for that dataset.

Conclusion
In the algorithm which is based on the maximum likelihood framework, the perfect fit for the loss function is Log loss since it calculates the entropy between the predicted and actual values. With this article, we have understood the log loss function.


