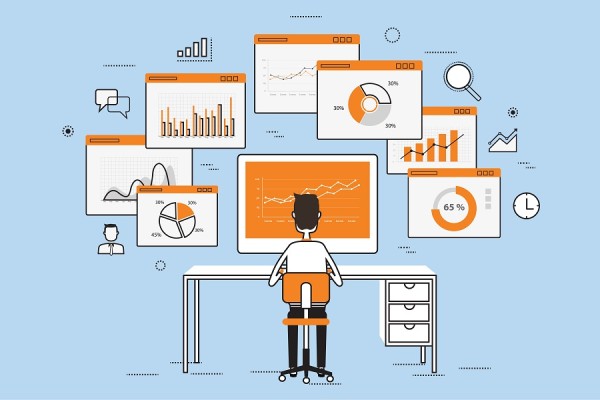
Dashboards have been one of the essential tools employed in data-driven companies to obtain insights and make informed decisions quickly. But how effective are they in the fast-growing data science landscape? Should data science aspirants learn analytics dashboards as they look to start a career in this field?
These questions have distracted aspirants, who already have a lot to learn in this space. They tend to get bewildered while planning their learning path that is focused on the most critical tools and technologies. For learners, this has been one of the long-standing predicaments when they start their journey in data analytics.
Why Dashboards?
Over the years, analytics dashboards have been used to tell compelling stories with data. It not only simplifies descriptive analytics, but also assists in extracting reports. Dashboards also allow users to share interactive visualizations without the need for a specific environment. This helps democratize data across organizations. Another prime reason for organizations to adopt dashboards is that non-experts can also use it, since anyone can be trained quickly to carry out basic visualization functions to make data-driven decisions. However, one should follow best design principles and practices for creating effective dashboards.
Dashboards For Streaming Analytics
Although one can learn programming languages and do more than what any dashboards can deliver, aspirants should be proficient in dashboards as it keeps evolving to help companies bring in efficiency. Organizations collect a colossal amount of data, but fail to process them instantly. However, dashboards are empowering users to implement streaming analytics for quick insights.
Along with batch processing, real-time analytics has become essential for organizations to gain a competitive advantage by harnessing the power of data on the go. While dashboards are enabling companies to integrate various data sources, it reduces the need for siloed data, gaining operational cost savings.
Streaming analytics is the next wave in the analytics industry. Thus, dashboards have become crucial for companies, not only for visualization, but also to lead in the next generation analytics trends.
Advancement In ML Functionality
Earlier, dashboards were only used for visualization, but with the advancement in their formula language, users can mould data, and create ML models with the integration of programming languages such as R and Python. Besides, one can easily query in natural language to trigger analytics from data with the help of various AI-based bots.
Today, dashboards like Qlik bring API integration with AutoML platforms such as DataRobot for advanced analytics and ML. AutoML solutions are gaining popularity as they reduce the workloads of data scientists. Therefore, being familiar with dashboards is crucial for automation in ML too. It will help aspirants work with other AutoML platforms by integrating with analytics dashboards to create state-of-the-art solutions and reports.
How Effective Are Dashboards?
Despite the advantages, dashboards fail to live up to the hype within organizations. This is because doing ML workloads tends to become too strenuous for users. Therefore, they stick to using it mostly for visualization and obtaining descriptive statistics. Besides, dashboards can mislead you in numerous ways.
However, this should not stop you from mastering dashboards as organizations are adopting tools that work with a few clicks, such as DataRobot, Big Data tools, and even some cloud services that work similar to dashboards. Companies are streamlining their workflows with numerous intuitive tools that require minimal programming. Thus, being proficient in dashboards will help you quickly learn different data science tools that companies use. Therefore, you should learn to create dashboards from a well-devised business analytics course. Further, aspirants should enrol in courses that provide one-on-one mentorship to ensure they can create practical dashboards that bring value on the table.
Outlook
Automating data science workflows is crucial for organizations since the data silo is continuously increasing. And dashboards have the potential to assist firms in simplifying organizations’ data initiatives while ensuring increased efficiency. Today, dashboards might not be the core of most data-driven organizations. But firms still see value in advanced analytics tools. Undoubtedly, many analytics and data dashboards have lost their shine, but at the same time, tools like Power BI and Tableau, and Qlik, have kept enhancing their solutions to assist firms in easily managing data science workflows. Consequently, aspirants should not ignore the importance of dashboards and include it in their learning path.


