
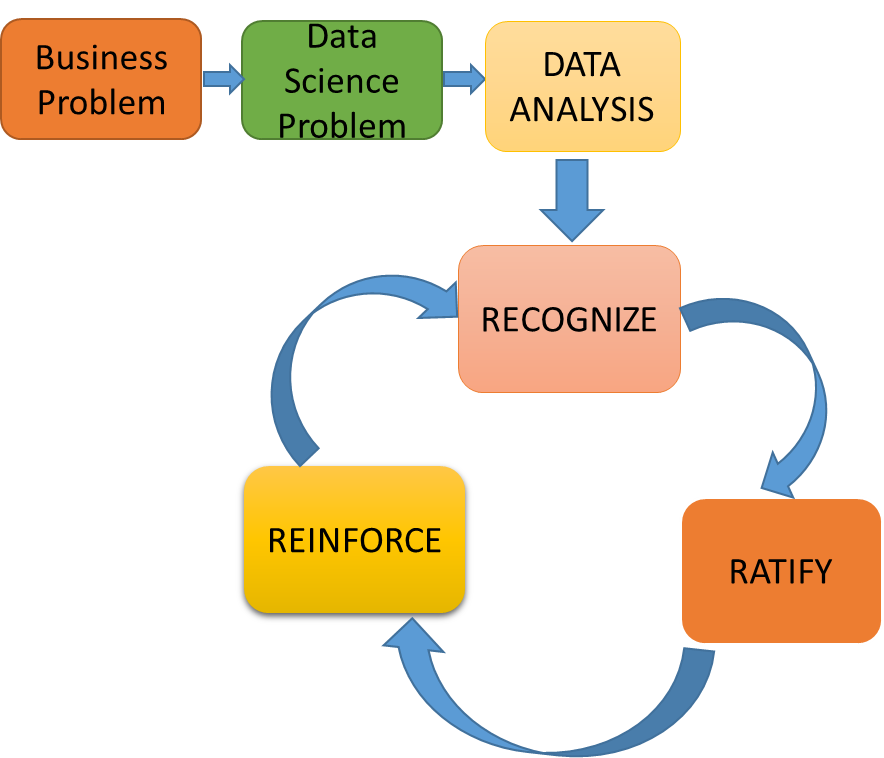
There is nothing better than choosing the right data for your analytics, every data analyst has to curtail a problem statement by inferring the data, right selection can bring value to the further journey. One of the easiest ways to understand is through fact-finding using basic statistics, data visualisation, and other techniques to understand and infer the meaning, this is where the statistician in you will be able to help. While there are different ways to be able to build this skill in your journey, I believe these 3 R’s will help you succeed.
- Recognise: Data classification using Descriptive, Inferential Statistics and various sampling techniques
- Ratify: Approve your thought process for each finding you have in the process, never carry assumptions, have consultations with business stakeholders and confirm the findings. Incorrect data decisions have a straight influence on the impact it creates further down the chain.
- Reinforce: At every step in assessing your data, there will be loads of new learnings uncovered on how to approach a data problem, at times this is quite unique to the kind of business problem you are trying to solve, maintaining a log of learnings and ensuring you reinforce it back into the data processing lifecycle later is crucial as not only it speeds up the things, will also help you provide transparency into the model and build a sustainable solution.
In this article, I have provided my view on various statistical techniques available at hand that you will be applying to recognise your data better.
It all starts with identifying a data series for a problem which is typically a collection of observations often collected as a sample space, a random subset from a given population, descriptive statistics helps us understand and compare the various dimensions of sample space. Here are a few quick measures available to assess the data better.
- Distribution helps to identify the range of values within the data set for a given numeric feature and allow us to mark each observation to one of the available buckets, it gives a quick classification view of where it belongs and easily helps in finding an outlier.
- Central tendency helps identify the correlation of each observation against what we called a nominated central value. There are different means of adopting a central value, the quite common ones that you hear are mean (average), median (middle half) and mode (most recurring value).
- Dispersion provides a view on the spread of given data series from their mean, it is quite common that when you compare two different series they look alike and might be completely different at their spread, widely used methods to measure dispersion is standard deviation, it provides a scaled-down view of the deviations.
Understanding the data spread is as well a typical need, helps to make a decision on the data and to understand the correlation. There are different facets to it if distributed to three equal bins, each is termed as a quartile and median lies on the second Quartile (Q2), Q1 and Q3 are referred to as Lower and Upper Quartiles. Difference between first (Q1) and third quartile (Q3) is called Interquartile Range (IQR). If you choose to split into to 5 equals, each is referred as Quintile, If 10 then it’s a decile. Sample space at times is divided into n-subsets where each nth split is referred to as quantile.
Ensure you have a fair view on the data by looking at what we call a normaliSation graph, an example is here and it is quite possible that you have a skewed distribution due to the presence of an outlier observation in a sample space. An analyst in you will then have to treat these data points.
Mean is heavily influenced by an outlier observation, replace any missing values in continuous data through its mean and categorical choose a mode (most recurring value.)

As it is quite not possible to understand the entire population. Inferential Statistics helps us validate a set of samples and review if they have the right information. Most widely used is the Hypothesis or significance testing.
To conclude this article, nature of data is what signifies the direction of your outcome hence it is important as an analyst you gather and analyse data for your data lifecycle and it will influence the decision making process.
I hope this article helped you in getting started with basic statistics and thumb rules of how to improve the thinking behind data selection, this is the first building block behind all modelling techniques used in a machine learning solution.