With the increasing recent developments in smart and artificially intelligent systems, the use of Neural Networks has become highly apparent. Neural Networks are ideally suited to help and solve complex problems in real-life situations. They possess the ability to learn and model the relationships between inputs and outputs that are nonlinear and complex, make generalizations and inferences, reveal hidden relationships, patterns and predictions from the data being processed using Neural Networks. Neural Networks use processing, inspired by the human brain, as a basis to develop algorithms that can be used to model and understand complex patterns and prediction problems. There are several types of neural networks and each has its own unique use. The Self Organizing Map (SOM) is one such variant of the neural network, also known as Kohonen’s Map.
In this article, we will be discussing a type of neural network for unsupervised learning known as Self Organizing Maps. Here is a list of major points that we will cover in this article.
Table Of Contents
- What is a Self-Organizing Map?
- Uses Of Self-Organizing Maps
- The architecture of Self-Organizing Maps
- Pros And Cons Of Self-Organizing Maps
- Implementing Self-Organizing Maps Using Python
What is a Self-Organizing Map?
A self-organizing map is also known as SOM and it was proposed by Kohonen. It is an unsupervised neural network that is trained using unsupervised learning techniques to produce a low dimensional, discretized representation from the input space of the training samples, known as a map and is, therefore, a method to reduce data dimensions. Self-Organizing Maps are very different from other artificial neural networks as they apply competitive learning techniques unlike others using error-correction learning methods such as backpropagation with gradient descent, and use a neighbourhood function to preserve all the topological properties within the input space.
Self-Organizing Maps were initially only being used for data visualization, but these days, it has been applied to different problems, including as a solution to the Traveling Salesman Problem as well. Map units or neurons usually form a two-dimensional space and hence a mapping from high dimensional space onto a plane is created. The map retains the calculated relative distance between the points. Points closer to each other within the input space are mapped to the nearby map units in Self-Organizing Maps. Self-Organizing Maps can thus serve as a cluster analyzing tool for high dimensional data. Self-Organizing Maps also have the capability to generalize. During generalization, the network can recognize or characterize inputs that it has never seen as data before. New input is taken up with the map unit and is therefore mapped.
Uses Of Self-Organizing Maps
Self-Organizing Maps provide an advantage in maintaining the structural information from the training data and are not inherently linear. Using Principal Component Analysis on high dimensional data may just cause loss of data when the dimension gets reduced into two. If the data comprises a lot of dimensions and if every dimension preset is useful, in such cases Self-Organizing Maps can be very useful over PCA for dimensionality reduction. Seismic facies analysis generates groups based on the identification of different individual features. This method finds feature organizations in the dataset and forms organized relational clusters.
However, these clusters sometimes may or may not have any physical analogs. Therefore a calibration method to relate these clusters to reality is required and Self-Organizing Maps do the job. This calibration method defines the mapping between the groups and the measured physical properties. Text clustering is another important preprocessing step that can be performed through Self-Organizing Maps. It is a method that helps to verify how the present text can be converted into a mathematical expression for further analysis and processing. Exploratory data analysis and visualization are also the most important applications of Self-Organizing Maps.
Architecture and Working of Self-Organizing Maps
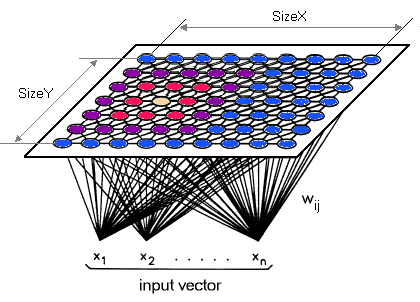
Self-Organizing Maps consist of two important layers, the first one is the input layer, and the second one is the output layer, which is also known as a feature map. Each data point in the dataset recognizes itself by competing for a representation. The Self-Organizing Maps’ mapping steps start from initializing the weight to vectors. After this, a random vector as the sample is selected and the mapped vectors are searched to find which weight best represents the chosen sample. Each weighted vector has neighboring weights present that are close to it. The chosen weight is then rewarded by being able to become a random sample vector. This helps the map to grow and form different shapes. Most generally, they form square or hexagonal shapes in a 2D feature space. This whole process is repeatedly performed a large number of times and more than 1000 times.
Self-Organizing Maps do not use backpropagation with SGD to update weights, this unsupervised ANN uses competitive learning to update its weights i.e Competition, Cooperation and Adaptation. Each neuron of the output layer is present with a vector with dimension n. The distance between each neuron present at the output layer and the input data is computed. The neuron with the lowest distance is termed as the most suitable fit. Updating the vector of the suitable neuron in the final process is known as adaptation, along with its neighbour in cooperation. After selecting the suitable neuron and its neighbours, we process the neuron to update. The more the distance between the neuron and the input, the more the data grows.
To simply explain, learning occurs in the following ways:
- Every node is examined to calculate which suitable weights are similar to the input vector. The suitable node is commonly known as the Best Matching Unit.
- The neighbourhood value of the Best Matching Unit is then calculated. The number of neighbours tends to decrease over time.
- The suitable weight is further rewarded with transitioning into more like the sample vector. The neighbours transition like the sample vector chosen. The closer a node is to the Best Matching Unit, the more its weights get altered and the farther away the neighbour is from the node, the less it learns.
- Repeat the second step for N iterations.
Pros And Cons Of Self-Organizing Maps
There are several pros and cons of Self-Organizing Maps, some of them are as follows:
Pros
- Data can be easily interpreted and understood with the help of techniques like reduction of dimensionality and grid clustering.
- Self-Organizing Maps are capable of handling several types of classification problems while providing a useful, and intelligent summary from the data at the same time.
Cons
- It does not create a generative model for the data and therefore the model does not understand how data is being created.
- Self-Organizing Maps do not perform well while working with categorical data and even worse for mixed types of data.
- The model preparation time is comparatively very slow and hard to train against the slowly evolving data.
Implementing Self-Organizing Maps Using Python
Self Organizing Maps can easily be implemented in Python using the MiniSom library and Numpy. Below is an example of a Self Organizing Map created on iris data. We will see how to use MiniSom to cluster the seed dataset.
!pip install minisom

from minisom import MiniSom

# Initializing neurons and Training

n_neurons = 9
m_neurons = 9
som = MiniSom(n_neurons, m_neurons, data.shape[1], sigma=1.5, learning_rate=.5,
              neighborhood_function='gaussian', random_seed=0)

som.pca_weights_init(data)
som.train(data, 1000, verbose=True)  # random training
To visualize the result of our training, we can plot the distance map or the U-Matrix, using a pseudocolor where the neurons present in the maps are displayed as an array of cells and the color represents the weighted distance from the neighbouring neurons. On top of the pseudo color we can further add markers that represent the samples mapped into the specific cells:

To understand how the samples are distributed across the map, a scatter chart can be used where each dot represents the coordinates of the winning neuron. A random offset can be added to avoid overlaps between points within the same cell.

To understand which neurons of the map are activated more often, we can create another pseudocolor plot that reflects the neuro activation frequencies:
plt.figure(figsize=(7, 7))
frequencies = som.activation_response(data)
plt.pcolor(frequencies.T, cmap='Blues')
plt.colorbar()
plt.show()

Conclusion
Self-Organizing Maps are unique on their own and present us with a huge spectrum of uses in the domain of Artificial Neural Networks as well as Deep Learning. It is a method that projects data into a low-dimensional grid for unsupervised clustering and therefore becomes highly useful for dimensionality reduction. Its unique training architecture provides ease of implementation for clustering techniques as well.
In this article, we understood Self-Organizing Maps, its uses and architecture and how it works. We also discussed the pros and cons of Self-Organizing Maps and explored an example of it being implemented in Python. I would like to encourage the reader to explore and implement this topic further due to its sheer learning potential.
Happy Learning!


