

Processing an image in order to derive some meaningful information from the image is known as image processing. It can be called a scientific study where we apply different methods or functions on images to find out what are its different features. We can enhance the image or degrade the image in order to extract unique features.
Mahotas is a computer vision and image processing library for python. It is implemented using C++ so it is fast and it operates over NumPy arrays. Currently, it has around 100 functions for computer vision and image processing.and is ever-growing.
In this article, we will explore what are the different functions and methods that are there in Mahotas which can be used for image processing.
Implementation:
Like any other python library, we can install mahotas using pip install mahotas.
- Importing required libraries
We will import all the functionalities of mahotas and other than that we will import pylab for image display functions.
from mahotas import *
from pylab import imshow, show
- Loading the image
We can use any image for image processing. I am using a bird image that I downloaded from google. We will use mahotas to load the image.
img = mahotas.imread('/bird.jpg')
imshow(img)
show()

- Performing Different Operations
Now we will perform different operations using mahotas and find out the important features and information about the image we are using.
- Finding Mean
The mean of an image is calculated by finding calculating the sum of the pixel values and divide it with the total number of pixel values. It is a statistical measure that can be used for spatial filtering and noise reduction in image processing. Mahotas can calculate the mean of an image but one channel data time, as our image is colored we will reduce it to one channel and find the mean of that channel.
img1 = img[:, :, 2]
mean = img1.mean()
print("Mean Value ", mean)
imshow(img1)
show()

- Crop Image
Here we will use the crop function in order to crop the image.
img2 = img[:, 300:1200]
imshow(img)
show()

- Finding Eccentricity and Roundness
The eccentricity of an image measures the shortest length of the paths from a given vertex v to reach any other vertex w of a connected graph. While roundness measures how closely the shape of an object approaches that of a mathematically perfect circle. Roundness is dominated by the shape’s gross features rather than the definition of its edges and corners. We will filter the image to find both the values for one channel.
img = img[:, :, 1]
ecc = mahotas.features.eccentricity(img)
rnds = mahotas.features.roundness(img)
print("Eccentricity =", ecc )
print("Roundness = ", rnds)

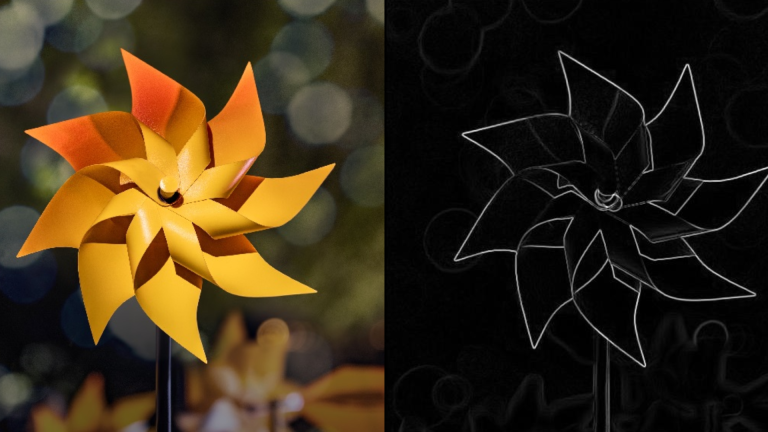
- Dilating and Eroding Image
Dilation adds pixels to the boundaries of objects in an image, while erosion removes pixels on object boundaries. We will implement both dilation and erosion to our image.
#Dilate
dilt = mahotas.morph.dilate(img)
imshow(dilt)
show()

#Erosion
erd = mahotas.morph.erode(img)
imshow(erd)
show()

- Maxima of Image
We will find the local maxima which are the local peaks in the image and regional maxima which is a stricter version of the local maxima and work on more than the neighbourhood. For finding the maxima we need to filter the image using the max function.
#Local Maxima
img2 = img.max(2)
lmaxim = mahotas.locmax(img)
imshow(lmaxim)
show()

#Regional Maxima
rmaxim = mahotas.regmax(img2)
imshow(rmaxim)
show()

- Overlay of Image
Overlay image creates the greyscale of the given image but with possible boolean overlays. We will do it for 1 channel.
img = img[:, :, 0]
ol = mahotas.overlay(img)
imshow(ol)
show()

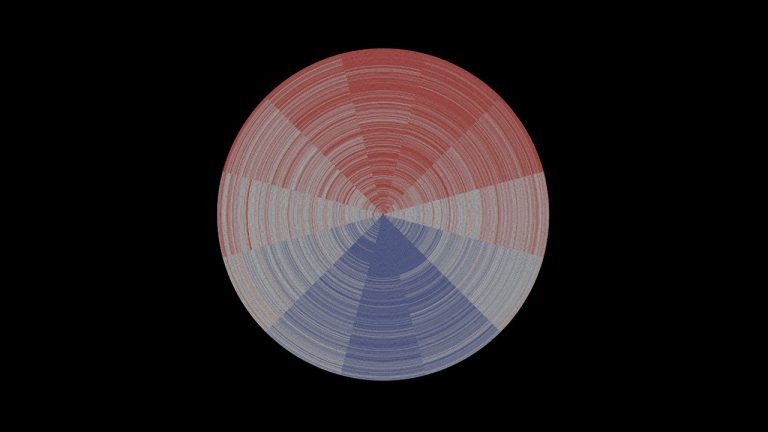
- Histogram of Image
A histogram of an image acts as a graphical representation of the tonal distribution in an image and plots the number of pixels for each tonal value. We need to import matplotlib for visualizing the histogram.
import matplotlib.pyplot as plt
img_hist = mahotas.fullhistogram(img)
plt.hist(img_hist)

Conclusion:
In this article, we saw how we can use mahotas for image processing. We saw some very basic to advanced functions to extract and visualize the features of the image. Similarly, there are many more functions which we can use for image processing. We saw how easily and effortlessly we can process the image using mahotas in just a single line of code.