There is a lot of talk about democratization of data science nowadays. But, who is doing what? Of course, we have datasets being open-sourced by tech majors, proliferation of frameworks and platforms which can deploy pretrained models.
The “what to do” part of data science is constantly being improved but the “how to” part is left out. There are few mandatory steps like scripting for iterative processes or visualization to get a project going.
What if there is an option where an amateur can do sophisticated stuff just by moving things around on their touch screen? No doubt this will be interactive and most importantly- easy.
The drag and drop gesture for touch screens, which is taken for granted, does simplify a lot of things for the users. A team at MIT, is trying to bring the same interface to the world of data science. They call this interface Northstar.
Northstar is an interactive data science platform that rethinks how people interact with data. It empowers users without programming experience, background in statistics or machine learning expertise to explore and mine data through an intuitive user interface, and effortlessly build, analyze, and evaluate machine learning (ML) pipelines.
The system provides a fundamentally re-thought data analytics stack with innovations across three areas:
- User Interface
- Interactive Data Exploration Accelerator
- Automated ML
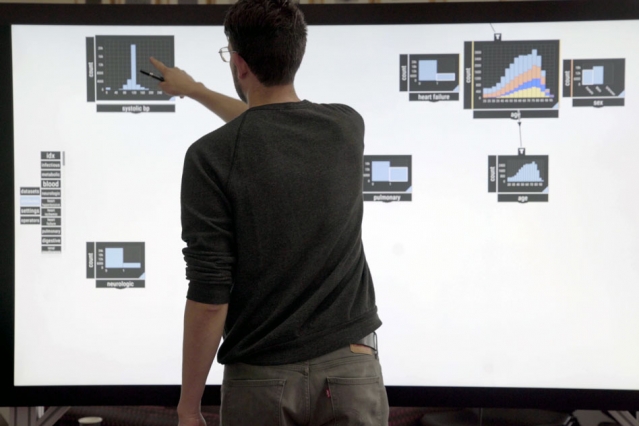
The tool Northstar can be used collaboratively on different devices and is designed in such a way that anyone can use it by just dragging the information from dataset and then connecting two features for correlation just by drawing a line; like in MS Paint.
Like in the above example, the data related to heart failure with respect to age, gender and other such factors are being checked. Doctors can check the correlations between different data points by just dragging the plot from the left panel and then connecting them to other such plots in which they expect to see a relation and use this to just run an algorithm for prediction, which is just a click away.
The virtual data scientist component of the Northstar instantly generates machine learning models on the datasets for making predictions.
“It’s like a big, unbounded canvas where you can lay out how you want everything,” says Emanuel Zgraggen, who is the key inventor of Northstar’s interactive interface. “Then, you can link things together to create more complex questions about your data.”
According to the researchers, VDS is the fastest interactive AutoML tool to date, thanks, in part, to their custom “estimation engine.” The engine sits between the interface and the cloud storage. The engine leverages automatically creates several representative samples of a dataset that can be progressively processed to produce high-quality results in seconds.
This cuts down the latency that usually results from lack of technicality amongst the users. People don’t have to wait for hours to get back results. Drag, drop, detect flaws and rectify. The procedure gets as simple as it sounds.
To evaluate the performance of this interface, the researchers evaluated Northstar on 300 real world datasets. The results show that the Virtual Data Scientist predicts not only as good as AutoML but also faster.
There is a catch to this effort to democratize analytics. The algorithms have flaws. Bias can be one of them. The datasets come in with corrections to account for privacy. For example, in a medical dataset, patients aged 0 doesn’t always mean that they are newborns. It can also mean that they have been labeled to preserve patient privacy. So, in such scenarios, the user needs this extra information to perform analytics. Given the sensitivity of these applications, it is not a big ask to have extra knowledge when you been served with machine learning pipelines on platter.
Future Direction
Imagine a pharmacist holding a tablet with Northstar installed, now they can check the various incoming data from the news outlets or other sources regarding the spread of certain diseases in a city and can get their inventory ready for emergency. The farming community can make some educated decisions with such tools. Any teenager who has a smartphone can use this tool. With some idea over variables that can affect the outcome, the users can visualise the impending reality of affairs. From rainfall prediction for farmers, to traffic congestion analysis for the city road planners, tools like Northstar will equip the non-technical population with the powers of machine learning.
Watch drag and drop in action in this video: