

Flood risk management is one of the biggest challenges facing risk and asset managers today. Due to the limited understanding of the factors that determine the likelihood of these events, disaster risk is inherently challenging to model. It requires better understanding across forecast, prevention, mitigation, and recovery planning phases.
Existing hydrological models and complex GIS are traditional methods of identifying any natural disasters using geospatial data. Though considered powerful tools for flood risk assessment, these models are difficult to implement, understand and maintain. Additionally, these solutions require many tools, have an exorbitant cost of acquiring or building a multipurpose geospatial structure, and are difficult to deploy on a broader scale.
As an alternative, open and lightweight tools have emerged with the development of remote sensing and the availability of high-quality geospatial data. Computing power has become cheaper as well. Newer processors and graphics units come equipped with higher horsepower and more efficient algorithms.
Leveraging these improvements, this research aims to develop an analysis framework built on open-source technologies to assess the flood risk in an area using geographic analysis and freely available remote sensing and precipitation data.
Need for better Flood Risk Management
Flood – one of the most destructive natural disasters affecting nearly everyone across the globe. Climate change has increased the frequency of floods, even in areas that may have never seen one before. An efficient early warning mechanism will enable better measures to prevent large-scale loss of lives and property.
To predict flood risk in India, one must first identify the most flood-prone areas. Looking at the natural features that affect flooding, such as rivers, mountains, and swamps, is the best way to start. Then, using satellite images taken before the disaster, one can assess which areas are most likely to be affected by flooding. This method will help gather more information about disaster risks in specific areas of India, which can be used to plan appropriate flood prevention and management measures to save lives.
Challenges Faced
A literature search shows that the existing system for flood-risk planning is based on limited applications of precipitation data or geographic sensors.
This research project provides an improved framework to use geospatial data and historical precipitation analysis for flood analysis based on data gathered for Bengaluru. It proposes that there should be better uses of freely available historical precipitation data, satellite imagery, and open-source technology suites to predict and assess on-site flood risk.
As research progressed, satellite data proved to be more complex than any other factor. Some of the problems faced in the course of the project were:
- The collection of satellite data sources because most of the available satellite data sources are paid for industrial use. Finally, the Bhuvan dataset from ISRO (Indian Space Research Organization) provided a solution.
- Pre-processing the satellite imagery of the target area because constructing the data for Bengaluru was a little tricky.
- Implementing the indentation model of the floods and the filling algorithm.
Methodology & Data Sets Used
The project aims to provide reliable and accurate satellite images for long-term flood control and management planning. Therefore, varied data sources were explored when accessing satellite aggregation.
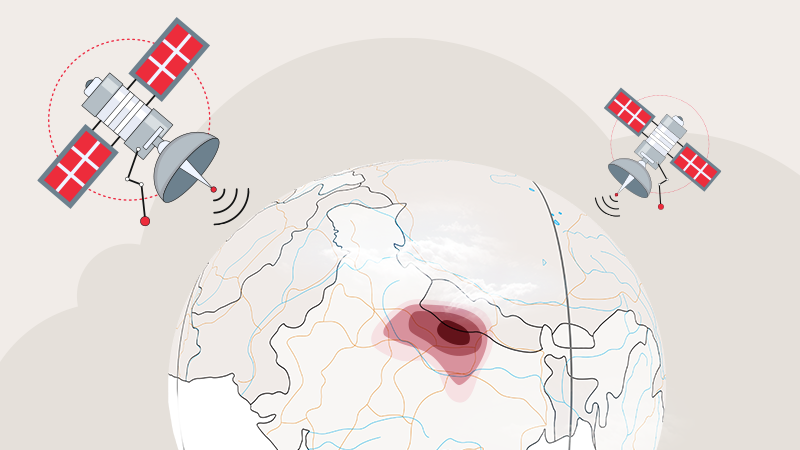
Remote sensing has become a popular method for monitoring natural disasters. The data it generates can provide low-cost, dynamic, and real-time macro information that is very different from traditional methods. Multispectral Digital Elevation Model (DEM) raster images from satellites are now freely available and can effectively simulate the impact of terrain and floods on the terrain.

CartoDEM is a national digital elevation model which provides high-resolution satellite data through the Cartosat-1 segment. The main goal is to create a new flood map layer based on field data. By using high-resolution images, one can distinguish small objects in each pixel of the image.
The method starts with the first rainfall prediction model to ascertain the likelihood of heavy rain in the topographic area. In the second step, DEM is used to determine the consequences of the flood and analyze the survey area’s topography.
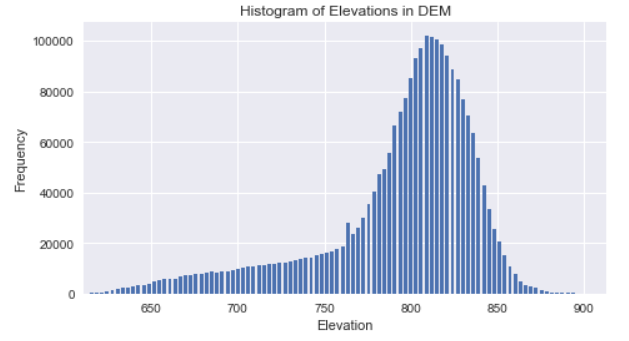
The descriptive analysis of the elevation is used to perform a visual survey of the terrain. In addition, a grouping study is carried out on these areas to understand the different high and low areas.

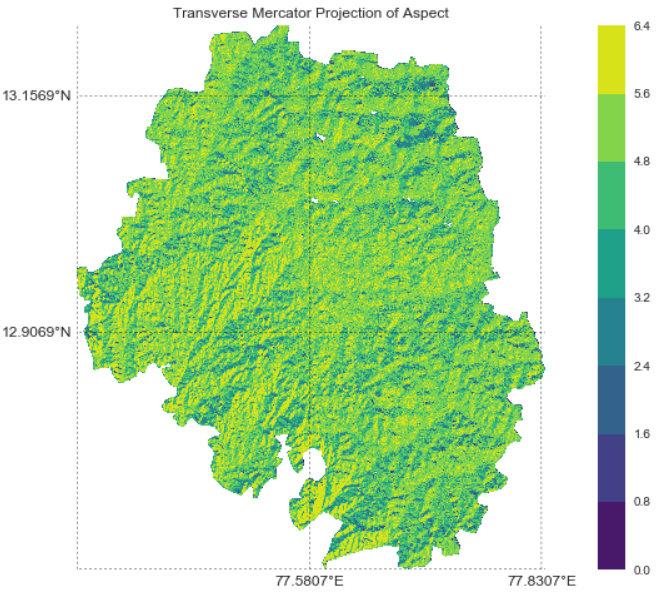
The exploratory analysis calculates each point’s slope and aspect ratio in the DEM grid by comparing the height of a point with the height of its neighbours.
- Slope is the steepness or incline of the surface.
- Aspect is the direction of the slope, from 0 to 360 degrees, where 0 means north, 90 means east, and 180 means south and clockwise, and 270 falls to the west.
These factors are essential for determining the change in elevation, the direction of water flow, and solar radiation.
How will the Outcome address existing Gaps?
The final result of the project has matched the original scope. Descriptive analysis can help arrive at essential observations related to specific locations.
Bengaluru’s topology has fewer elevation changes and is not very high. In the centre of the district, there is a ridge extending from the north to the south. Part of the highest point is on this ridge. There are slopes and valleys on both sides of the ridge. The landscape of the land in the southern part of Bengaluru is more uneven than in the northern part of the county.
The DEM data, rainfall forecast model, and heavy rain model readings are verified. Seasonality is discounted, and then the model starts to work within an acceptable range to make the model more realistic. However, the model isn’t perfect and needs more effort to make it work efficiently.
Practical Applications of the Research Work:
- Since this model is built on the Flood Fill algorithm and utilizes geospatial data, the result can immensely help urban planning. Specifically in India, most metro cities contain a mixture of old and new architectures and require extensive planning for any expansion project.
By coupling this model with real-life machine learning (ML) diagrams, city officials can generate maps of surrounding areas and select the best approach to expand the city beyond its limits safely, mitigating the effects of future natural disasters. It also aids in developing fast and efficient recovery models by analyzing previous data and utilizing future forecasts.
- The insurance industry can leverage this model to forecast natural calamities, primarily floods, and manage insurance better. More often than not, insurance companies are in the centre of the financial recovery hurricane that immediately follows a natural disaster. A more recent example of companies caught off guard was the Houston floods of 2019 that created an insurance nightmare. With the advent of rapid weather changes fueled by global warming, forecasting disasters has paramount value.
- The model can be expanded beyond its urban use cases to rural areas that pose the biggest challenge in India. By building a database of geospatial information, ML can be leveraged to create models that forecast natural calamities across terrain types and automatically generate recovery plans. Robust and data-driven flood damage minimization and recovery plans can be built utilizing the financial, demographic data of the particular area.
_________________________________________________
Arijit Naskar is an upGrad learner, and as a part of his program, he has developed the thesis report titled — Flood risk prediction using Geospatial Satellite data.