In data science, it is a basic requirement of any modeller to know about what he is trying to perform and how the models are working. Along with that, which model will give the best result according to the data set is also a must to know. Here the term interpretability comes into the picture. Interpretability is the degree of any decision which can be understood by a human before finalizing the decision. Higher interpretability of a machine learning model means it is easier to understand why a certain decision or prediction has been made.
One of the most basic machine learning models is a simple linear regression model. It is suggested that this is the one thing which if you can improve can become a swiss knife from a simple blade. In this article, we will discuss the improvements with interpretability in the context of the simple linear regression model where we will try to find the best fit model by making certain improvements. As the name suggests, this article will give an overview of the Generalized Additive Models (GAM) which are basically used for the enhancement of the simple regression model. In this article, we will mainly discuss the below list of major points.
Major points to be covered in this article:
- Why Generalized Additive Models (GAM)?
- What is GAM?
- Implementing GAM using Python
Let’s proceed with our discussion.
Why Generalized Additive Models (GAM)?
This article assumes that the reader has basic knowledge of linear regression models. In a linear regression model, the results we get after modelling is the weighted sum of variables. This is a weakness of the model although this is strength also. But when it comes to modelling with data whose distribution is not following the Gaussian distribution, the results from the simple linear model can be nonlinear. There are various modifications we can perform to improve the model.
GAM(Generalized Additive Model) is an extension of linear models. As we know, the formula of linear regression is:
y=β0+β1X1+…+βpxp+ϵ
This assumes that the weighted sum of the p features with some error ϵ expresses the outcome y that follows the gaussian distribution. By putting data into the formula we obtain good model interpretability if the features are linear, additive and have no interaction with each other.
It means that a change in the input feature can produce a similar magnitude change in the outcome. This is an ideal model with ideal data. Problems come with the real-world data where a simple weighted sum is too restrictive.
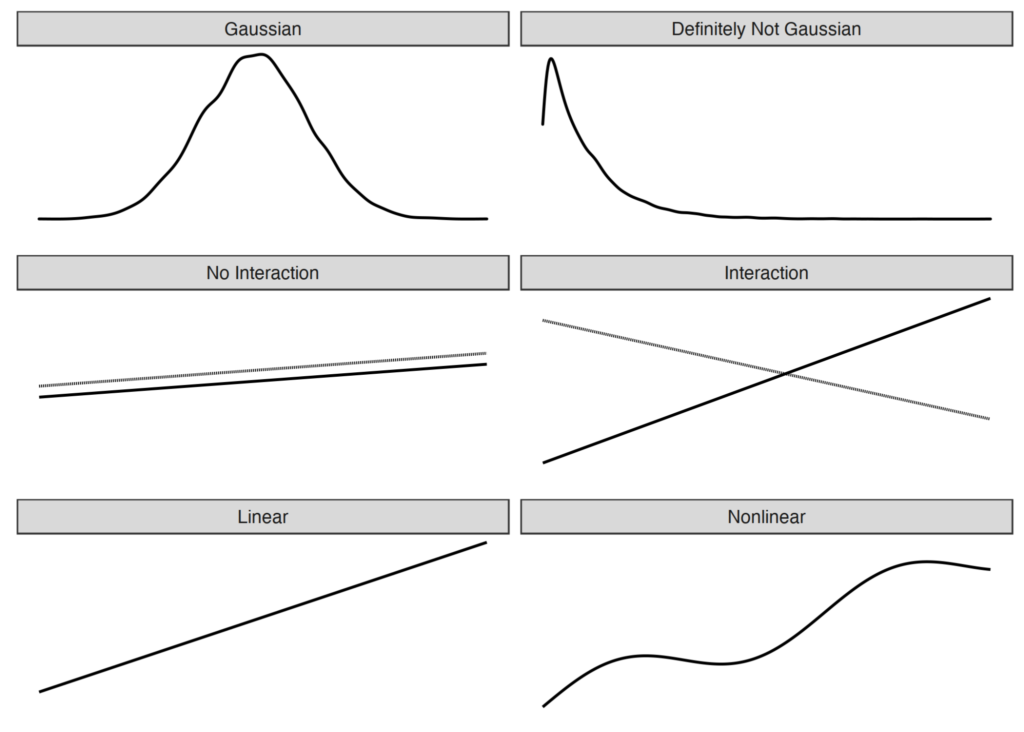
There are various problems that occur in real-world modelling which can violate these assumptions. Three main basic problems are:
- The target outcome y given the features does not follow a Gaussian distribution.
- The independent features interact.
- The true relationship between the dependent features and independent features is not linear.

In the above image, we can see the line graph structure which represents an ideal condition on the left side and the real-world problems on the right.
By using different extensions in different problems we can make a model predict accurately by considering uncertainty into the account. Like if the data is not following Gaussian distribution we can use a generalized linear regression model or if the data is nonlinear we can use GAM( generalized additive models.
What is a Generalized Additive Model (GAM)?
If the data is having a nonlinear effect, in such a case we use GAM. Linearity in models means that the changes of one unit in predictors can cause the same effect on the outcome of the model. If at some point, changes in feature not affecting the outcome or impacting oppositely, we can say that there is a nonlinearity effect in the data.
In this situation, we can model relationships using one of the following techniques.
- A simple transformation of the features.
- Categorization of the feature.
- Generalized additive models (GAMs).
GAM is a model which allows the linear model to learn nonlinear relationships. It assumes that instead of using simple weighted sums it can use the sum of arbitrary functions of each variable to model the outcome.
The formula of GAM can be represented as:
g(EY(y|x))=β0+f1(x1)+f2(x2)+…+fp(xp)
It is pretty similar to the formula of the regression model but instead of using BiXi (simple weighted sum), it uses f1(X1) (flexible function). In the core, it is still the sum of feature effects. Instead of modelling all relationships, we can also choose some features for modelling relationships because it supports the linear effect also.
Splines are functions that can be used in order to learn arbitrary functions. The spline function can make a variety of shapes to model the relationship in a better way.
The image represents the difference between GAM and simple linear regression.


We can clearly see above that the simple regression model is finding difficulties in modelling relationships with all the data points. Where GAM is flexible according to the data points and will give better results than the simple regression model.
Implementing GAM in Python
The python package pyGAM can help in the implementation of the GAM. Here in the procedure, we will use wage data where features are age year and education and the target variable is salaries.
We can install it using pip like this.
pip install pygamImplementing GAM and checking the summary of the model.
from pygam.datasets import wage
from pygam import LinearGAM, s, f
X, y = wage()
gam = LinearGAM(s(0) + s(1) + f(2)).fit(X, y)
gam.summary()
Output:

In this model, we have fit the spline term to the first 2 variables and the factor term to the 3rd variable.
In the summary we can see that the spline term uses 20 basic functions, it is highly recommended to use a large number of spline terms and then the smoothing penalty will perform better in the regularization of the model.
Next, I plotted the partial dependence for each term in our model.


In the model we put the age and year in spline and education as a factor. In the plots, we can see the contribution of each feature to the overall prediction. The dotted lines around the main line are standard errors.
Since the main motivation to perform GAM in any dataset is that data should have a nonlinear effect. It is very clear in the graph that the increase in the year does not affect the salary. Sometimes it is increasing and after 2006 it is decreasing. The curves of the variables age and year are because of the smoothing function.

The above image consists of all feature functions of the model and can see the effect of each variable on the target variable. In the image, we can see all the variations on the target variable caused by other features.
This Python package provides the implementation of various generalized additive models like:
- GAM.
- LinearGAM.
- LogisticGAM.
- GammaGAM.
- PoissonGAM.
As we have discussed before, GAM is the model which can take linear terms, and intercept into consideration. This package also provides models which can take these terms into account. So if any feature is not nonlinear to the target we can simply use a linear term for them. Or the feature which is having an intercept effect can be taken into the model using the intercept term.
Final words
Here in the article, we have seen why the GAM comes into the picture when the data is not according to the simple linear model. We also saw how it is similar and different from the simple linear model and how we can implement it. In the documentation of the pyGAM we can find various other features which can be useful for you like grid search, regression models to the classification models almost everything required is given and explained.
References:


