Machine learning and AI have now become an integral part of many industries and our daily lives. To build a machine learning model you need to understand some of the fundamental concepts of mathematics such as linear algebra, statistics, and importantly all the algorithms and techniques related to ML. Even if you are done with the above, to implement a model you additionally have to know programming languages such as Python or R. These all kinds of to-do’s and issues are quite tedious and become a major challenge for beginners in this field, especially for the persons from non-technical backgrounds.
However, there are a few GUI-based tools available such as WEKA, KNIME, Tableau Server, IBM SPSS Statistics, etc to help people in their data science-related tasks with almost no coding requirements. In this article, we will discuss KNIME with its major functionalities. To start with KNIME, you need to first install it by following a simple installation procedure at the official site. The major discussion points in this article are listed below.
Table of Contents
- What is KNIME?
- The Workbench
- Workspace
- Console and Node Monitor
- Description
- Explorer
- Nodes Repository
- Outline
- Nodes
- Building a Simple Workflow
What is KNIME?
KNIME stands for Konstanz Information Miner which was developed at the Konstanz University, Germany in 2004. It is open-source software written in Java. KNIME relies on predefined components called Nodes for building and executing the workflow. Its main functionalities include the tasks related to machine learning, data minings, data analysis, and manipulations.
KNIME provides a graphical interface for the entire development. In KNIME we simply need to define the workflow between the various predefined nodes provided in its Nodes Repository. It provides several predefined components for tasks as mentioned earlier. Additionally, it provides extra features and functionality through various extensions and support from community support.
The workbench
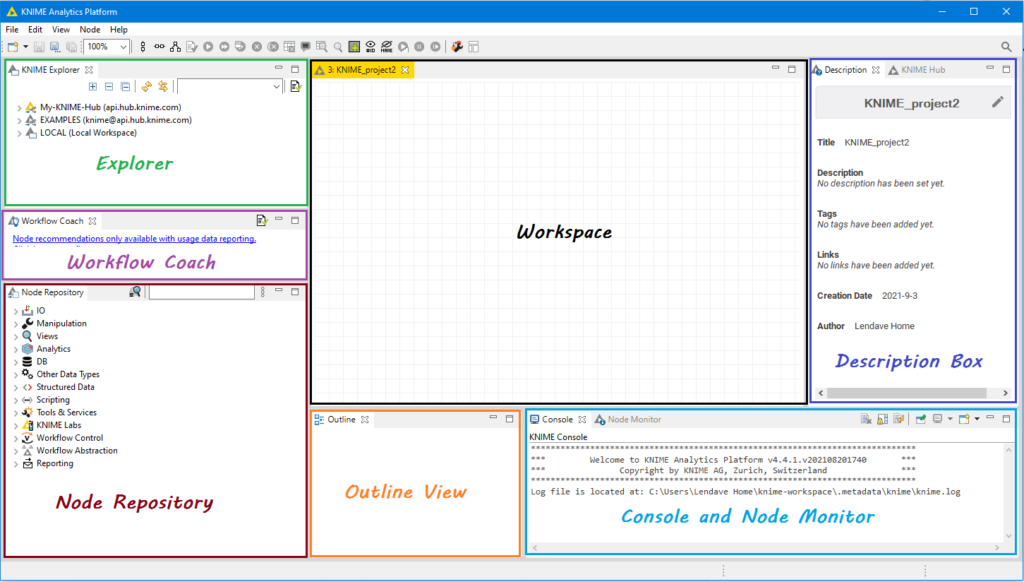
When you open the KNIME Analytics Platform after installing it, you will come across the interface as shown below in which I have annotated each window of the workbench and we will walk through each in detail.
Workspace
The workspace is the place where workflows are created which are made by individual tasks represented by nodes. The nodes are connected using the arrow by dragging them in between. We can freely move any node anywhere in the workspace. Here in the workspace, we can write a small description for each node. In the empty workspace editor, to create a new workflow we can simply add nodes/components from Node Repository.
To create a new workspace go to the File—> New. There select the option as New KNIME Workflow then next assign a name to your project. By clicking on Finish you will start with a new Workspace window.
Console Node Monitor
The console window shown at the bottom of the workbench shows us all the working and execution messages. It is also useful for diagnosing workflow errors and examining the analytics results.
Besides the console, there is Node Monitor which is especially used to inspect immediate output tables in the workflow
Description
The description is located at the right of the workbench as shown in the above layout. It provides a description of a currently active workflow, selected node/component at workspace, or workflow editor. For workflow, first is a general description followed by tags and links to other related resources. For nodes/components, first is the general description that shows the available settings for it and a list of all input-output ports available at particular nodes.
Explorer
In explorer, we can manage workflow, workflow groups, and server connections. As you can see, the first two categories are defined at the KNIME server, the third option is locally used to store the workspace that we have created. You can explore these tabs as there various pre-loaded examples are available to get started with the KNIME platform.
Nodes Repository
The node repository lists all the various nodes/components available for analytics. The entire repository is nicely categorized based on node functions. Under each category, you will have several options and nodes. E.g under IO you will get nodes to read your data in various file formats supported such as CSV, EXCEL, XLS, ARFF, etc.
The implementation of various algorithms can be done from this repository. To apply any algorithm simply pick a desired node from the repository and drag and drop it to your workspace. Connect the output of the data reader to the ML node and this makes the workflow ready for execution.
Outline
The outline is available at the bottom of the workbench as shown in the layout where we can find a GUI overview of our project. If the whole project is not visible at the workspace we can change the active region of our project by scrolling in the Outline window.
Nodes
In KNIME, all individual tasks are represented by nodes where it can perform all sorts of tasks including reading and writing files, transforming data, training the ML models, creating visualization and so on.
As you can see in the above nodes, each node is displayed as a colored box and symbol associated with its function with input and output ports as well as status shown below in the rectangle box. The input ports hold the data that it processes and the output port holds the resulting status of the node. The data is transferred from the output port of one node to the input port of the succeeding sequence. You can change the status of each node manually and configure it by right-clicking on it and so many options are available to play.
Build Simple Workflow
Here we will try to plot two charts – a bar chart and a pie chart. After creating a new workbench, search for file reader in Node repository drag and place it in the workspace similarly drag and drop two nodes for the chart by searching them in the repository. Connect all the nodes together by dragging arrows from each node to the relevant node. Your workflow and workspace should look as given below.
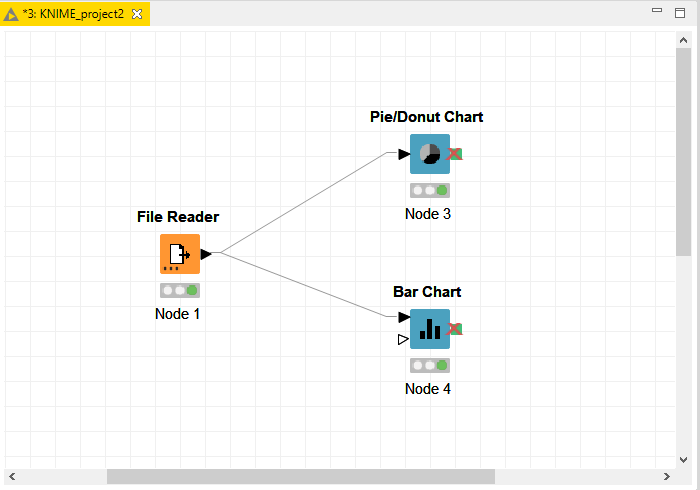
After joining all the nodes we need to configure each node separately. It can be done by right-clicking the node. For example, to load a CSV file, we need to configure the File reader by navigating the destination of the file in your local machine. Similarly, for charts, we have selected the columns for which information is to be shown.
After configuring all, execute all the nodes and check node console status carefully to ensure execution tools are placed. Lastly, the plots are obtained as shown below.

Conclusion
In this article, we have gone through a Data mining tool called KNIME. The interactive and enhanced visualization can draw more interest towards your analysis and model building. By using a variety of options and components present at the repository we can do nearly all ML and data mining tasks. For beginners, I recommend going through the pre-loaded examples covered for various topics which can give ideas on how to use the interface.


