


YFinance came as a support to those who became helpless after the closure of Yahoo Finance historical data API, as many programs that relied on it stopped working. YFinance was created to help the programs and users who were relying on the Yahoo Finance API. It solves the problem by allowing users to download data using python and it has some great features also which makes it favourable to use for stock data analysis. YFinance not only downloads the Stock Price data it also allows us to download all the financial data of a Company since its listing in the stock market. It’s easy to use and is blazingly fast. This library is pretty famous for Financial Data Analysis.
In this article, we will explore YFinance and learn what we can do. The stock we will be working on here is Pfizer, a Pharmaceutical Company listed in NASDAQ. YFinance is highly recommended for Financial Reporting as it provides you with each and every detail you require about the company and its stock. Through this article, we will cover the following points:-
Table of contents
For using YFinance we first need to install it, we can install it by pip install finance. We will start by importing the required library i.e. yfinance.
import finance as yf
Selecting the Stock by its Symbol
By using ticker function we pass the stock symbol for which we need to download the data. Here we are working with Pfizer and the ticker for it is”PFE”. Let us call the ticker function to initialize the stock we will be working on.
yf.Ticker('PFE')
Displaying Information on Selected Stock
After initializing the ticker function let us now display all the Financial data related to the company by using “info”. It will display all the information regarding the company including its Sector, No. of Employees, Business Summary, etc.
pfizer.info

Downloading the Stock data
Now let us download the stock data using the ‘history’ function. We can pass the argument like start and end to set a specific time period else we can set period to max which will download all the stock data since it’s listing in the market.
 old  =  pfizer.history(start="2010-01-01",  end=”2020-07-21”)
old.head()

Displaying relevant Information
Financial Data Analyst requires the details about the Dividends and Splits the company has given to its shareholders. With the ‘actions’ function of YFinance, we can download this.
pfizer.actions

Other than the “actions’ function we can use ‘dividends’ and ‘splits’ functions separately to view them individually.
pfizer.dividends
pfizer.splits
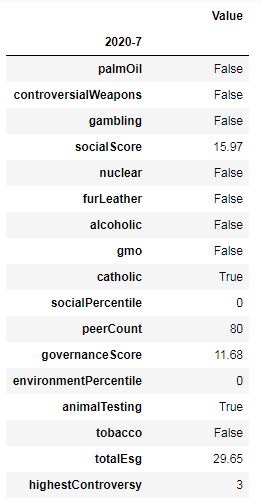
To know the sustainability of the stock there is a predefined function named “sustainability’ which can be used to display data about the sustainability of the company.
Recommendations for buying or selling a company’s stock is provided by different Finacial Firms. In order to analyze the stock price, we must know what these firms recommend. To analyze the recommendations we can use the “recommendations” function.
pfizer.recommendations

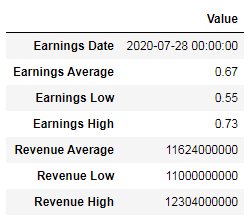
“calendar” function can be used to know about the earnings and revenue of the company.
pfizer.calendar
For every company listed on the stock market, there is a unique ISIN(International Securities Identification Number) no. we can retrieve this number using YFinance “isin” function
pfizer.isin

'US7170811035'
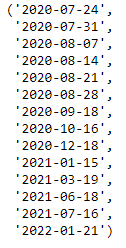
During option trading we must know about the option expiry date, using the “options” function we can retrieve the Option Expiry Date of that particular stock.
pfizer.options
These are the main functions of YFinance which can be used for stock data analysis. Similarly, we can use these functions for more than multiple stocks data analysis.
Visualizing the Stock Data
We can plot the stock data using Plotly, a python library used for visualization and it also allows us to download the visualization as an image. The most commonly used charts for stock data analysis are Candlestick Chart, Line Chart, and OHLC Chart.
Before visualizing the stock data we need to reset the index of the data frame in which our data is stored and we need to convert the columns to float type.
old = old.reset_index()
for i in ['Open', 'High', 'Close', 'Low']:
      old[i]  =  old[i].astype('float64')
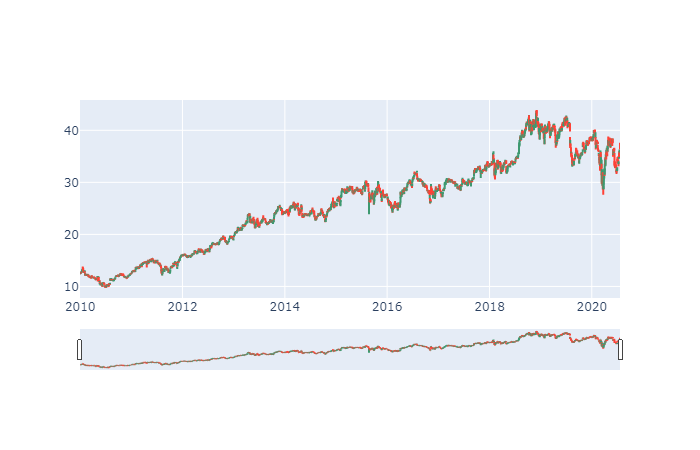
Candlestick Charts
Let us plot a candlestick chart with a Range Slider using plotly. Candlestick charts are used for technical analysis and can help decide the Buy, Sell, or Hold strategy.
import plotly.graph_objects as go
fig = go.Figure(data=[go.Candlestick(x=old['Date'],
                                   open=old['Open'],
high=old['High'],
low=old['Low'],
close=old['Close'])])
            fig.show()
Line Charts
Line Charts are the conventional charts and most commonly used one. They are used by most of the fundamental and technical analysts to decide strategies.
import plotly.express as px
            fig = px.line(old, x="Date", y="Open", title='PFizer Stock Prices')
            fig.show()

OHLC Charts
OHLC(Open, High, Low, and Close) charts are similar to candlestick charts and are important as they work on the closing price.
fig = go.Figure(data=go.Ohlc(x=old['Date'],
                    open=old['Open'],
                    high=old['High'],
                    low=old['Low'],
                    close=old['Close']))
           fig.show()

Conclusion
YFinance is a library that is highly recommended for Financial Data Analysts as it provides you with all the Financial and Stock related data of all the firms that are listed on the stock market and you don’t need to maintain a record locally. It can be used to create a detailed financial report of different companies. Similarly, we can visualize the data using Plotly and create highly interactive and visually appealing charts/graphs for further analysis of the stock data.
Popular Posts