

Traditional time series forecasting models like ARIMA, SARIMA, and VAR are based on the regression procedure as these models need to handle the continuous variables. Random forest is also one of the popularly used machine learning models which have a very good performance in the classification and regression tasks. A random forest regression model can also be used for time series modelling and forecasting for achieving better results. In this article, we will discuss how time series modelling and forecasting be done using a random forest regressor. The major points to be discussed in the article are listed below.
Table of contents
- About random forest regressor
- Using random forest regression in time series
- The modelling procedure
- Importing libraries
- Data conversion
- Model fitting
- Loading data
- Models evaluation
Let’s start by having a quick look at the random forest regression.
About random forest regressor
A random forest model is an ensemble of many decision trees where the decision trees are known as weak learners. It can be applied to classification and regression problems. Also, it is a widely used model for regression analysis. The regression procedure using random forest can be accomplished in the following steps:
- Data splitting: The process goes through the splitting of features and each row is responsible for the creation of decision trees.
- Decision making: Every tree makes its individual decision based on the data.
- Decision aggregation: In this step average value predictions from trees become the final result.
This average of decisions from trees makes random forest regression stronger than any other algorithm. Let’s see why we should use random forest regression with time series analysis.
Using random forest regression in time series
Since a random forest is an ensemble of decision trees, it has lower variance than the other machine learning algorithms and it can produce better results. Talking about the time series analysis, when we go for forecasting values, we use models like ARIMA, VAR, SARIMAX, etc. that are specially designed for time series analysis. These models are based on regression analysis. We can also use basic regression models with time series which can give a state-of-the-art performance in time series modelling as well. Ensembling some trees to lower the variance of models can also help in time series modelling. In the next part of this article, we will look at how we can use the random forest model in time series modelling.
The procedure
In the procedure, we will be using the daily total female births dataset that can be obtained from here. The module we are using for a random forest regression model is from Scikit learn library. Since the module we are using is designed to work with supervised learning datasets, we will be converting time series into supervised learning data. After conversion, we will spit and walk through the validation of univariate data. After fitting data into the model we will cross-check accuracy based on mean absolute error. Let’s start by importing libraries.
Importing libraries
For this procedure, we will be using only pandas, NumPy, matplotlib, and sklearn library.
import numpy as np
import pandas as pd
import matplotlib.pyplot as plt
from sklearn.ensemble import RandomForestRegressor
from sklearn.ensemble import RandomForestRegressor
Data conversion
This section of the procedure implements a function that can convert a time series into supervised learning data.
def series_to_supervised(data, n_in=1, n_out=1, dropnan=True):
    n_vars = 1 if type(data) is list else data.shape[1]
    df = pd.DataFrame(data)
    cols = list()
    for i in range(n_in, 0, -1):
        cols.append(df.shift(i))
    for i in range(0, n_out):
        cols.append(df.shift(-i))
    agg = pd.concat(cols, axis=1)
    if dropnan:
        agg.dropna(inplace=True)
    return agg.values
In the above function, we have defined the input sequence and forecast sequence and concatenated them. Also, we have dropped all the NaN values.
Data splitting
This section defines a function that can split the dataset.
def train_test_split(data, n_test):
    return data[:-n_test, :], data[-n_test:, :]
Model fitting
In this section, we will define a function that can help in fitting the converted data by the random forest regression model.
# fit an random forest model and make a one step prediction
def random_forest_forecast(train, testX):
    train = np.asarray(train)
    trainX, trainy = train[:, :-1], train[:, -1]
    model = RandomForestRegressor(n_estimators=1000)
    model.fit(trainX, trainy)
    yhat = model.predict([testX])
    return yhat[0]
This function transforms a list into an array then splits data and fits the model. After training the model, it will help us in making the one-step predictions.
Validation for univariate data
This section will utilize all the above-given functions and will fit test data with a model to predict and check the accuracy of the model.
from sklearn.metrics import mean_absolute_error
def walk_forward_validation(data, n_test):
    predictions = list()
    train, test = train_test_split(data, n_test)
    history = [x for x in train]
    for i in range(len(test)):
        testX, testy = test[i, :-1], test[i, -1]
        yhat = random_forest_forecast(history, testX)
        predictions.append(yhat)
        history.append(test[i])
        print('>expected=%.1f, predicted=%.1f' % (testy, yhat))
    error = mean_absolute_error(test[:, -1], predictions)
    return error, test[:, -1], predictions
Loading data
series = pd.read_csv(‘/content/drive/MyDrive/Yugesh/times series with random forest/daily-total-female-births.csv’, header=0, index_col=0)
values = series.values
data = series_to_supervised(values, n_in=6)
This will load the data and using the above function we will convert the data into supervised learning data.
Models evaluation
In this section, we will evaluate our model based on mean squared error.
series = pd.read_csv('/content/drive/MyDrive/Yugesh/times series with random forest/daily-total-female-births.csv', header=0, index_col=0)
values = series.values
data = series_to_supervised(values, n_in=6)
Output:
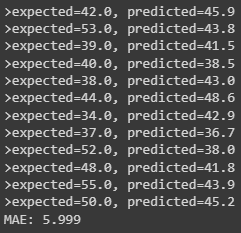
Here in the above output, we can see that we have an MAE of 5.999. This is a good indication. Let’s draw these predictions with test data.
plt.plot(y, label='Expected')
plt.plot(yhat, label='Predicted')
plt.legend()
plt.show()
Output:
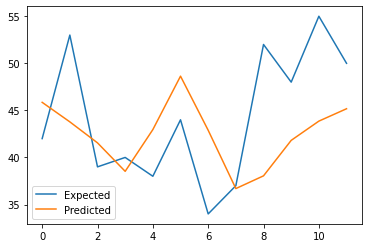
Here we can see the predicted values by the fitted random forest regression model. For better performance, we can change the parameters of the random forest regressor model.
Final word
In this article, we have discussed random forest regressors and why we should use them for time series analysis. After understanding the key concepts, we have gone through the implementation of a random forest regressor for the time series forecasting task.
References