


|
Listen to this story
|
Object detection models attempt to detect the existence of important things in pictures and classify those objects. A statistic known as Average Precision (AP) is used to assess the efficacy of the object recognition and localization method (and mean average precision). Precision scores from all classes do not add up to the average precision score. When recall values range from 0 to 1, the average precision value is computed. This article will focus on explaining the Mean Average Precision in the context of object detection. Following are the topics to be covered in this article.
Table of contents
- What is the Precision-Recall curve?
- What is Average precision (AP)?
- Using mAP as an evaluation metric
Let’s start from the basics of mAP which is the Precision-Recall curve.
What is the Precision-Recall curve?
The ROC-AUC curve (receiver operating characteristic curve) depicts a classification model’s performance overall categorization levels. Similarly, at IoU thresholds, there is a precision-recall curve that depicts the tradeoff between accuracy and recall.
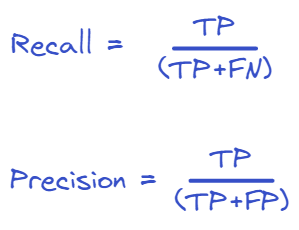
Precision is a measure of “how frequently does your model predict right when it guesses?” The recall is a metric that asks, “Has your model guessed every time it should have guessed?” Consider the following picture, which contains ten fruits. A model with great accuracy but poor recall discover just one of these 10 but correctly identifies it as “fruit” (only one of ten fruits has been found).
Models with a confidence component can trade off precision for recall by altering the amount of confidence required to make a prediction. In other words, if the model is in a situation where avoiding false positives (saying fruit is present when it was a vegetable) is more important than avoiding false negatives, it can raise the confidence threshold to encourage the model to only produce high precision predictions at the expense of reducing its amount of coverage (recall).
The precision-recall curve is the process of visualising the model’s accuracy and recall as a function of the model’s confidence threshold. It slopes downhill because as confidence falls, more predictions are produced which aids recall and fewer exact forecasts are made reducing precision.

The primary distinction between ROC curves and precision-recall curves is that the number of true-negative findings is not considered to calculate a PRC.
Are you looking for a complete repository of Python libraries used in data science, check out here.
What is Average precision (AP)?
The goal of Average Precision (AP) is to evaluate the detector’s accuracy throughout the whole recall domain. As a result, it prefers approaches with accuracy over the whole recall domain over detectors with Recall-Precision curves closer to the top-right corner.
In other words, AP compares the detectors’ overall performance rather than their highest capability/performance. Other parameters such as IoU, confusion matrix (True Positive, False Positive, False Negative), accuracy, and recall are used to construct AP.
If the class label of the predicted bounding box and the class label of the ground truth bounding box are the same and the IoU between them is larger than a threshold value, the prediction is said to be accurate.
We compute the following three metrics based on the IoU, threshold, and class labels of the ground truth and predicted bounding boxes.
- True Positive: The model predicted the existence of a bounding box at a specific place (positive), and it was right (true)
- False Positive: The model predicted the existence of a bounding box at a specific place (positive), but it was incorrect (false)
- False Negative: The model predicted a bounding box at a certain place but was incorrect (false), indicating that a ground truth bounding box existed at that location.
- True Negative: The model predicted a bounding box but it was incorrect (true). This relates to the backdrop, the region without bounding boxes, and is not utilised in the final metrics calculation.
Mathematics behind mAP
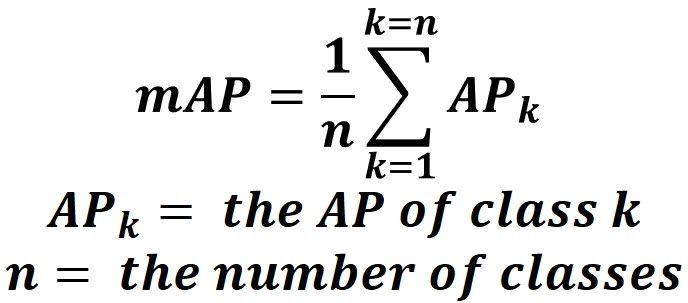
The area under the PR curve is used to determine the AP. The mean average precision (mAP) is a common metric used to assess the accuracy of an object detection model. The mAP for object detection is the average of all the APs computed. The average precision is mathematically expressed as:

Where,
p = precision
r = recall
Similarly the formula for mean average precision.
Using mAP as an evaluation metric
This article uses custom data which contains prediction scores and ground-truth values of two classes predicted by a machine learning model. Consider the two classes as “positive” and “negative”. A custom precision-recall curve will be built to visualize the precision and recall tradeoff.
Let’s import the necessary libraries.
import numpy as np
import pandas as pd
from sklearn.metrics import precision_score, recall_score
import matplotlib.pyplot as plt
Creating the data
As discussed creating two different datasets containing binary data.
y_true_class1 = ["positive", "negative", "positive", "negative", "positive", "positive", "positive", "negative", "positive", "negative","positive", "negative", "positive", "positive"]
pred_scores_class1 = [0.72, 0.38, 0.55, 0.64, 0.55, 0.91, 0.75, 0.28, 0.88, 0.35, 0.76, 0.8, 0.47, 0.68]
y_true_class2 = ["negative", "positive", "positive", "negative", "negative", "positive", "positive", "positive", "negative", "positive", "negative", "positive", "negative", "negative"]
pred_scores_class2 = [0.32, 0.97, 0.45, 0.17, 0.25, 0.99, 0.55, 0.33, 0.35, 0.85, 0.62, 0.54, 0.39, 0.69]
Set a threshold value ranging from 0.2 to 0.9 with the step of 0.05.
thresholds = np.arange(start=0.2, stop=0.9, step=0.05)
Define precision-recall curve
Because accuracy and recall are important, there is a precision-recall curve that displays the tradeoff between precision and recall values for different thresholds. This curve assists in determining the appropriate threshold to optimise both measures.
The precision-recall curve requires the following inputs:
- The labels of ground truth.
- The prediction scores
- The threshold value for converting prediction scores to labels.
def precision_recall_curve(y_true, pred_scores, thresholds):
    precisions = []
    recalls = []

    for threshold in thresholds:
        y_pred = ["positive" if score >= threshold else "negative" for score in pred_scores]

        precision = precision_score(y_true=y_true, y_pred=y_pred, pos_label="positive")
        recall = recall_score(y_true=y_true, y_pred=y_pred, pos_label="positive")

        precisions.append(precision)
        recalls.append(recall)

    return precisions, recalls
Calculate the average precision scores for the first datasets.
precisions, recalls = precision_recall_curve(y_true=y_true_class1,
                                             pred_scores=pred_scores_class1,
                                             thresholds=thresholds)

plt.plot(recalls, precisions, linewidth=2, color="red", zorder=0)

plt.xlabel("Recall", fontsize=12, fontweight='bold')
plt.ylabel("Precision", fontsize=12, fontweight='bold')
plt.title("Precision-Recall Curve", fontsize=15, fontweight="bold")
plt.show()

precisions.append(1)
recalls.append(0)

precisions = np.array(precisions)
recalls = np.array(recalls)

avg_precision_class1 = np.sum((recalls[:-1] - recalls[1:]) * precisions[:-1])
print('============================================')
print('Average precision score:',np.round(avg_precision_class1,2))

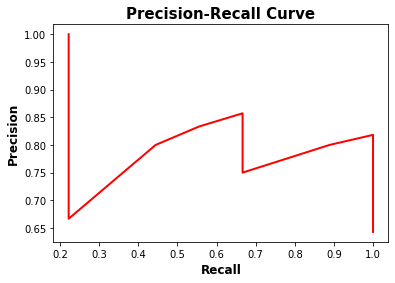
Here got an average precision score of 0.86 which is good and in the precision-recall curve, it could be observed that for initial threshold values the recall was low and the precision was high which is bad and for the rest thresholds the precision did not exceed 0.86. With this, it could be concluded that the tradeoff was balanced at a precision of 0.86 and a recall of 0.68.
Calculate the average precision scores for the second datasets
precisions_2, recalls_2 = precision_recall_curve(y_true=y_true_class2,
                                             pred_scores=pred_scores_class2,
                                             thresholds=thresholds)

plt.plot(recalls_2, precisions_2, linewidth=2, color="red", zorder=0)

plt.xlabel("Recall", fontsize=12, fontweight='bold')
plt.ylabel("Precision", fontsize=12, fontweight='bold')
plt.title("Precision-Recall Curve", fontsize=15, fontweight="bold")
plt.show()

precisions_2.append(1)
recalls_2.append(0)

precisions_2 = np.array(precisions_2)
recalls_2 = np.array(recalls_2)

avg_precision_class2 = np.sum((recalls_2[:-1] - recalls_2[1:]) * precisions_2[:-1])
print('============================================')
print('Average precision score:',np.round(avg_precision_class2,2))


Here got an average precision score of 0.83 which is good and in the precision-recall curve, it could be observed that for initial threshold values the recall was low and the precision was high which is bad and a sudden increase in recall but the precision was stable.
Calculating the mAP
num_labels= 2
mAP = (avg_precision_class2 + avg_precision_class1)/num_labels
print('Mean average Precision score:',np.round(mAP,3))

The mean average precision score for a dataset containing binary data is 0.836 which is obtained by taking the mean of the average precision.
Conclusion
The Intersection of Union (IoU) threshold influences the AP metric. When employing AP as an assessment measure for object detection, selecting the IoU threshold becomes an arbitrary procedure. With this article, we have understood the Average precision and Mean average precision evaluation metrics for object detection.


