|
Listen to this story
|
Databricks is a business software startup that provides Data Engineering tools for processing and transforming massive amounts of data to develop machine learning models. Traditional Big Data procedures are not only slow to complete jobs but also take more time to build up Hadoop clusters. However, Databricks is built on top of distributed Cloud computing infrastructures like Azure, AWS, or Google Cloud, which allow programmes to execute on CPUs or GPUs according to analytical needs. In this article, we will be learning about building a machine learning model in Databricks. Following are the topics to be covered.
Table of contents
- Data uploading
- Creating a cluster
- Data preprocessing
- Building the ML model
In this article, we will be building a multivariate linear regression model for predicting the charges on insurance offered by the company based on different features.
While logging in there are two options one is for business use with the cloud services and the other is for community usage. You can select anyone based on needs. In this article, we will use the community edition.
Data uploading
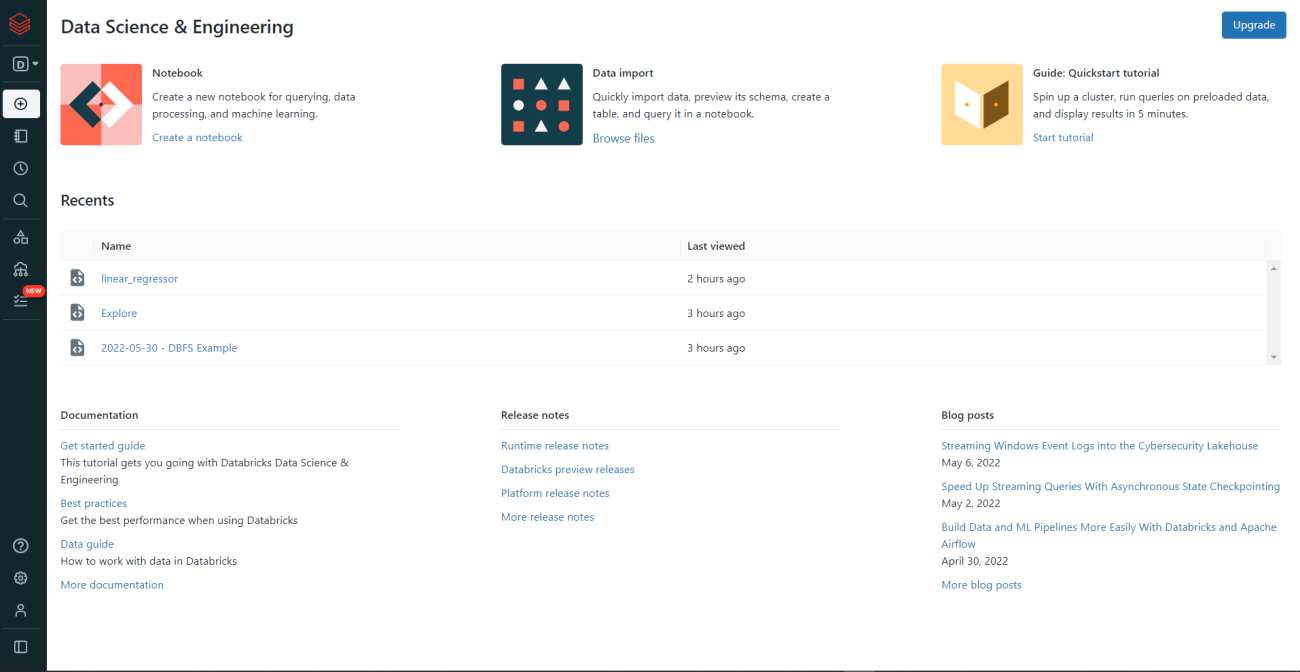
Once you have registered and logged on to the Databricks web page as a community edition user. To upload the data click on “Browse file” to upload the data from the local machine in the Data import section. The webpage looks like this.

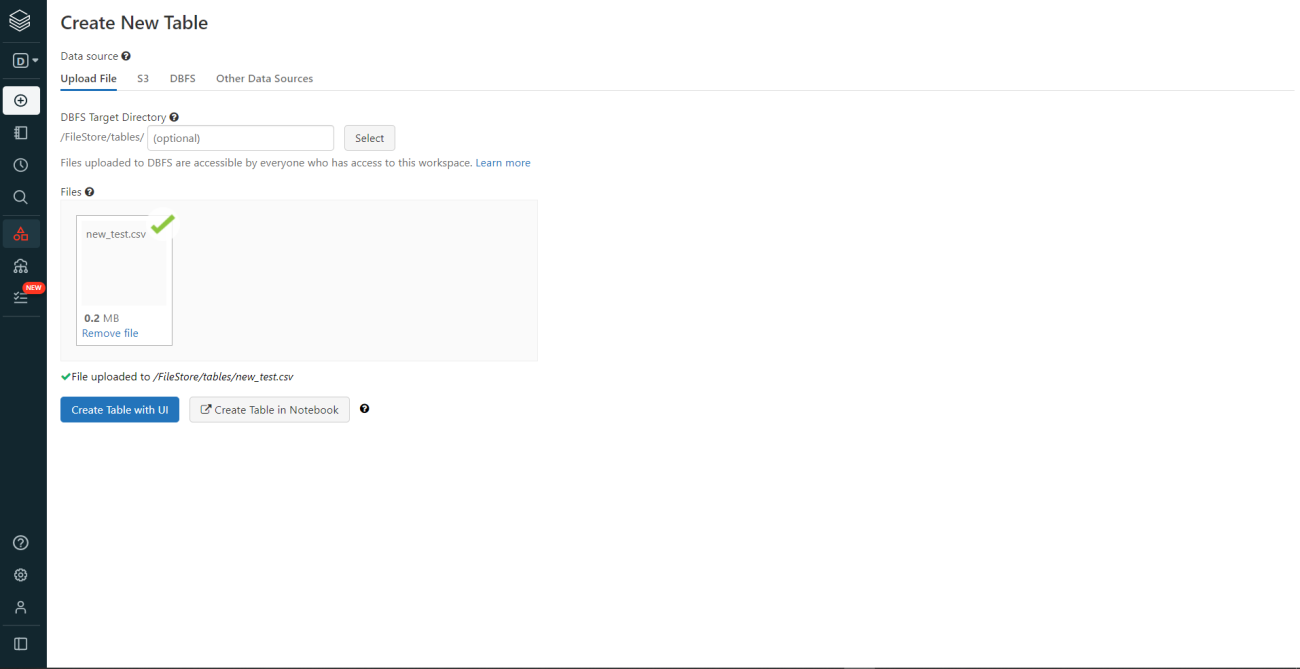
Once selected the file that is to be uploaded, the page would be redirected to the create a new table page. You can import and store the data using different sources. In this article, we are directly uploading the data and creating a new table in the notebook.

As in the above image, in the upload file section the file is being uploaded and now select the “Create Table in Notebook”.
To analyze the data we need to create a “Cluster”. Let’s see how to create a cluster.
Creating a cluster
A Databricks Cluster is a set of computing resources and settings that may be used to run tasks and notebooks. Streaming Analytics, ETL Pipelines, Machine Learning, and Ad-hoc analytics are some of the workloads that can be executed on a Databricks Cluster.
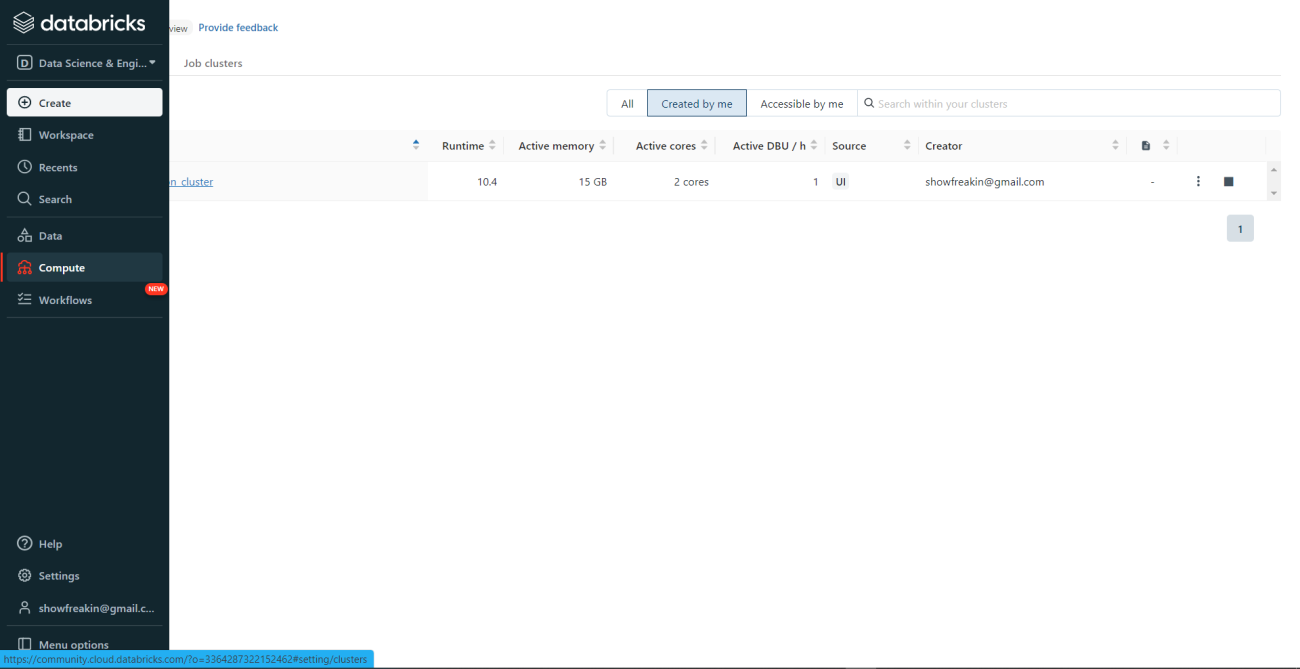
To create a cluster go to compute from the sidebar options and click on create a cluster.


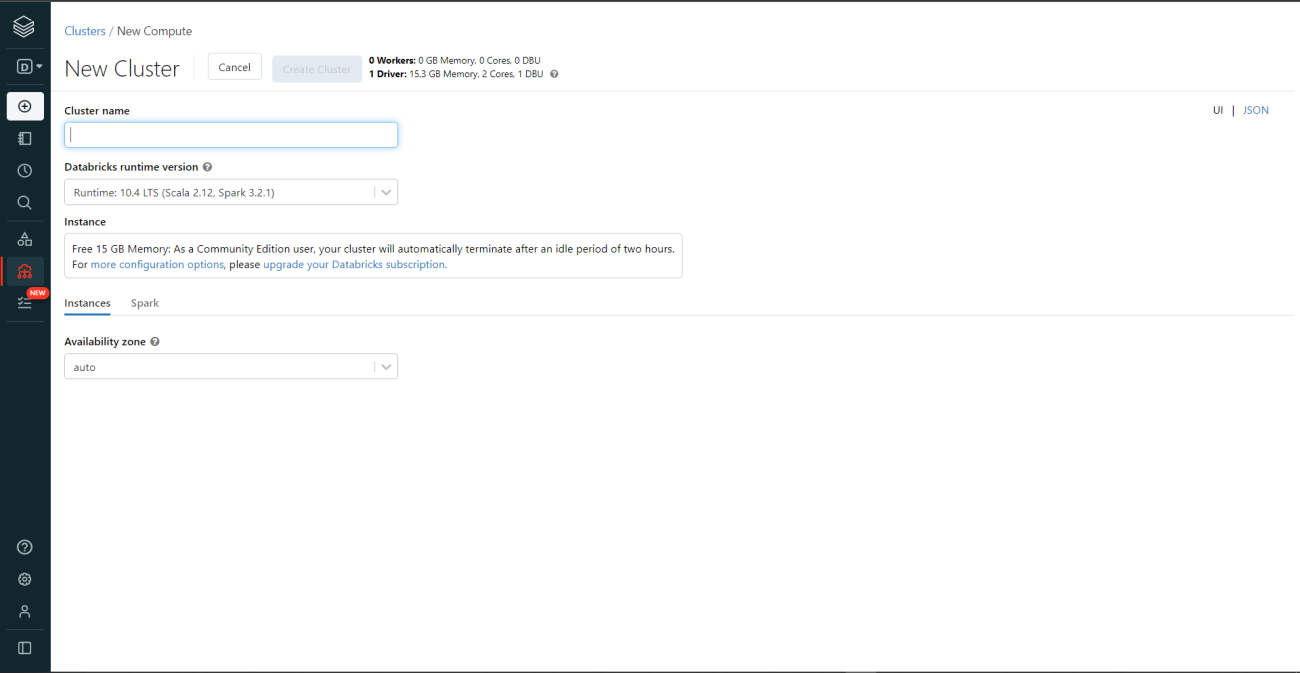
Define the cluster name and select the runtime version. In this article, we are going to use the Spark 3.2.1 version. So in the unpaid version, you can only use one cluster at a time to use multiple needs to upgrade to paid.

Data preprocessing
Once the data is uploaded and the cluster is created the data could be analyzed. A notebook would be created where you need to store the uploaded data into a table so that it could be used for further analysis.

Now let’s see the process to store and read the data from the table.
file_location = "/FileStore/tables/insurance.csv"
file_type = "csv"
data=spark.read.csv(file_location,header=True,inferSchema=True)
The schema is stored in the variable data. Let’s view the schema.
data.printSchema()

The data could be viewed by using the “show” function. Let’s view the data.
data.show()

Now convert the categorical data to numerical by using the encoder. For this article, we are using the ordinal encoder.
from pyspark.ml.feature import StringIndexer
indexer=StringIndexer(inputCols=['sex','smoker','region'],
                                     outputCols=['sex_enc','smoker_enc','region_enc'])
df=indexer.fit(data).transform(data)
df.show()
The “StringIndexer” is an ordinal encoder which will encode the categorical columns. The original data need to be fit and transformed into the encoded data.

To use the data for the training and testing purpose the independent variables need to be assembled in one column. The “VectorAssembler” will transform the features into a vector column. So, that the entire dataset could be used at once.
from pyspark.ml.feature import VectorAssembler
feature_assembler=VectorAssembler(inputCols=['sex_enc',
 'smoker_enc',
 'region_enc','bmi',
 'children','age'],outputCol="Independent features")
output=feature_assembler.transform(df)
output.select('Independent features').show()

Let’s save the independent variable and dependent variable into another variable. So to split it into train and test. The target variable is “Charges”
df_utils=output.select('Independent features','charges')
df_utils.show()

Building the ML model
The data has been processed and it is ready to be utilized for training and testing purposes. The data will be split into standard 70:30 ratio train and test respectively.
from pyspark.ml.regression import LinearRegression
train,test=df_utils.randomSplit([0.70,0.30])
lr=LinearRegression(featuresCol='Independent features',labelCol='charges')
lr=lr.fit(train)
The linear regression model is trained. Let’s check the coefficients and intercept of the linear relationship.
To check the coefficients of the independent variable use “.coefficients”
lr.coefficients

As there are six independent variables so there are six different coefficients.
To check the intercept of the linear line use “.intercept”
lr.intercept

Let’s evaluate the model performance. To evaluate the performance use “.evaluate” and store the results in a variable for further analysis.
pred=lr.evaluate(test)
pred.r2,pred.meanAbsoluteError,np.sqrt(pred.meanSquaredError)

The r_squared value is 0.74, the MAE is 4127.94 and the RMSE is 6063.94. We could say that the relationship between the dependent variable and independent variable is explained pretty well.
To check the predictions use “.predictions”
pred.predictions.show()

To deploy the model, save the model and then register. The model needs to be registered in the ML flow Model Registry. Once the model is registered it could simply reference this model within Databricks. It could be registered programmatically, as well as by UI in cloud services AWS, Azure, and GCP.
Conclusions
For data engineers, data scientists, data analysts, and business analysts, Databricks offers a Unified Data Analytics Platform. It is very adaptable across several ecosystems, including AWS, GCP, and Azure. Databricks ensure data reliability and scalability through delta lake. With this article, we have learned to build machine learning with Databrick in Apache Spark.


