|
Listen to this story
|
Before modelling with the data, analysis of the data is always a required task to perform to know its property. In data analysis, outlier detection is much needed as its presence may change the behaviour of data. If the data with outliers is pushed into a model it can provide various harm to the modelling. Generally, we consider an outlier detection process when the data is there with continuous values. In this article, we are going to discuss how to detect and handle the outliers in categorical data. The major points to be discussed in the article are listed below.
Table of contents
- About outliers
- Outliers in the categorical data
- Detecting outliers in the categorical data
- Dealing with outliers in categorical data
- Retention
- Exclusion
- Replacement
- Sampling
Let’s start first by discussing what is an outlier.
About outliers
In general, the word outlier means a non-living or living thing detached, different, or situated far from the main body or system. A simple example of this can be a classroom where a teacher is an outlier among all the students. In data science, this word has the exact meaning but the way we think about it is slightly different. In a dataset, we find a group of data points.
After drawing these data points in the space we find that they have captured their place in the space. This drawing will tell us how the data points are close to each other and if any or some data points are far from the dense area we can say that the data points far from the dense area are outliers. An example of outliers can be represented by the below image.

The presence of outliers in a data set is generally considered a problem that can cause many problems in our analysis and modelling. We mainly consider the outliers in the continuous data but this article is focused on the outliers in the categorical data. Let’s discuss what are outliers in the categorical data.
Are you looking for a complete repository of Python libraries used in data science, check out here.
Outliers in the categorical data
By looking at the above points, we can say that the outliers are the values that are far from the dense population. When working with the categorical data we may find the fault modelling condition when the data is biased with one or some categories while the number of categories present in the data is larger. However, there is no such concept of an outlier in the categorical data but categories with very lower or very higher frequency than the other categories can be considered as outliers in the categorical data.
Let’s take an example of the name of the colours in the data where we have proof that the data has 1000 values for red, 900 values for green, 800 values for pink and 100 values for black. Such data when goes into the modelling we can find that the model will not be able to make accurate predictions for the black colour. The reason behind this inaccuracy can be caused by the lower amount of data in black colour.
In categorical data, we are required to think of outliers as the values that are there in the data and need to be considered in the modelling and after modelling the accuracy of the model becomes low because of these values. The below image can be a representation of the outliers in the categorical data.
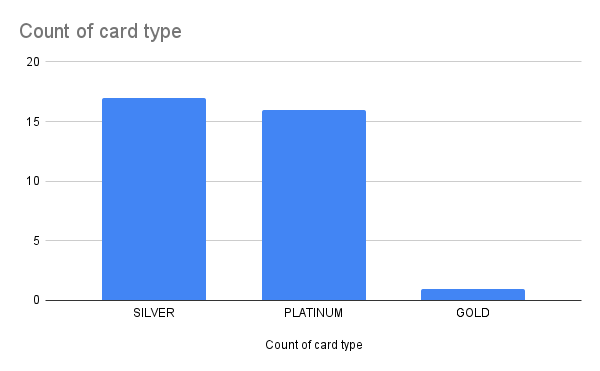
Let’s take a look at the below chart

Here we can see that occurrence of gold is very low and can be considered an outlier
Although there can be various reasons for being outliers in the categorical data such as fault collection of the data or categories can be rare and hard to collect data about it. In this article, we are mainly concerned about detecting and dealing with such outliers. One thing that is noticeable here is that we should not think of any category as outliers if the data has only two categories in it. Let’s discuss how we can detect outliers in categorical data.
Detecting outliers in the categorical data
In the case of categorical data, we are required to think about outliers in a different way, in the above we have seen that the outliers in continuous data can be detected using a scatter plot or box plot. Detecting outliers in the categorical data is something about the comparison between the percentage of availability of data for all the categories. We can find this comparison using the bar chart or histogram. In this article, we are using the titanic data where we can find that the column embarked has three categories in which one category can be considered as the outlier category.
Let’s see how can we do that
import pandas as pd
data = pd.read_csv('/content/employ_stat.csv')
data.head(10)
Output:
Let’s make a histogram.
ax = data['EMP_dependent'].plot.hist()
ax.set_ylabel("frequecy")
ax.set_xlabel("dependent_count")
Here we can see that a category is detached from the other categories and the frequency of this category is also low so we can call it an outlier in the data. This is an example of detecting the outlier. Let’s see what methods can be utilized to deal with outliers in the categorical data.
Dealing with outliers in categorical data
As in the above, we have seen how the outliers are different in categorical data so the techniques of dealing with such outliers are also different. In this section, we will find some of the optimal processes that can be used to deal with the outliers in the categorical data.
Retention
This process involves modelling the outliers with the other data. Sometimes it happens that in the data every point is very important and in such a condition we are required to find or make a model that can also work for the outliers and has the capability of dealing with even a small category of the data. A classification model can be used because they are robust to outliers to model data with naturally occurring outlier categories.
Exclusion
This method involves techniques to exclude the outliers from the data. As we have discussed, the reason for the presence of outliers in the categorical data can be the faulty collection of the data. If the categories are lower in volume and are not important for the analysis and modelling. We can simply discard them from the data before applying models to the data.
Replacement
Sometimes it happens that the data that is collected has outlier values but as a category, they are similar to the other major categories. In such cases, we can replace the outliers with similar categories. We can measure the similarity between the data using the measures like euclidean distance, cosine similarity, Manhattan distance etc.
Sampling
Outliers in the categorical data can also be said to the problem of class imbalance. This means that the data for every class are not in a similar proportion. In such a situation, we use some of the sampling techniques such as downsampling, oversampling and SMOTE analysis. Here we mainly increase or decrease the data points by knowing the importance of the categories in the modelling.
Final words
In this article, we have discussed the outliers in the categorical data that can be understood when the availability of any or some categories in the data is very low. Along with this, we have discussed the techniques we can use to detect the outlier in the categorical data and the processes that can be utilized to deal with outliers in categorical data.


