The Chi-Square test of independence examines whether or not two nominal (categorical) variables have a significant connection. Comparing the frequency of categories for one nominal variable with the frequency of categories for the second nominal variable. There are two utilizations of the chi-square test to check the independence of variables and to check the goodness of fit. In the article, we will be discussing the when and where the chi-square test could be utilized. Following are the topics to be covered.
Table of contents
- A brief about chi-square
- Uses of chi-square
- Implementing chi-square test
Let’s start by talking about the chi-square test.
A brief about chi-square
The objective is to determine whether the association between two qualitative variables is statistically significant.
The formulation of the hypotheses for this statistical analysis is something like this.
- Null Hypothesis (H0): There is no substantial relationship between the two variables (in case of independence test), or there is no difference in variable distribution (in case of goodness of fit).
- Alternative Hypothesis (H1): There is a substantial relationship between variables (in case of independence test) or a significant variation in variable distribution (in case of goodness of fit).
When the null hypothesis is true, the anticipated values for each cell in the table must be specified. The anticipated values describe what the values of each cell in the table would be if the two variables were not associated. The sample size, row totals, and column totals are all required by the algorithm for calculating anticipated values.
The chi-square statistic compares observed and anticipated values. This test statistic is used to see if the discrepancy between observed and predicted values is statistically significant.
Are you looking for a complete repository of Python libraries used in data science, check out here.
Uses of Chi-square test
A chi-square test is used to examine if observed findings are consistent with predicted outcomes and to rule out the possibility that observations are due to chance. When the data being studied is from a random sample and the variable in issue is a categorical variable, the chi-square test is applicable. These sorts of data are frequently gathered through survey replies or questionnaires. As a result, chi-square analysis is frequently the most effective in assessing this sort of data.
There are two main kinds of chi-square tests: the test of independence and the goodness-of-fit test.
Independence
When considering categorical variables that may be interdependent. A chi-square test for independence might be used to assess the association between categorical variables.
Assume there are two variables: gender and degree course and need to check whether gender depends on the course or course depends on gender. Then, using the chi-square formula of observed and predicted values, compare the frequency with which male and female employees choose from the available courses.
If there is no relationship between gender and course, implying that they are independent of one another, then the actual frequencies at which both genders choose each offered course should be expected to be approximately equal. The ratio of the gender of students in any selected degree should be approximately equal to the ratio of the gender in the sample.
A chi-square test for independence might indicate how probable it is that any observed divergence between the actual frequencies in the data and these theoretical predictions can be explained by random chance.
Goodness-of-Fit
The chi-square provides a way to test how well a sample of data matches the characteristics of the larger population that the sample is intended to represent. The sample data cannot be used to draw conclusions about the larger population if they do not reflect those of the target population. This kind of chi-square test is goodness-of-fit.
Assume a small library has the greatest number of members on Fridays and Sundays the average amount on Mondays, Tuesdays, and Saturdays, and the fewest on Wednesdays and Thursdays. Based on these predictions, the library hires a set number of employees each day to check in members, clean facilities, guards, and librarians.
However, the library is losing money, and the owner wants to determine if the frequency of member assumptions and staffing levels are right. For six weeks, the owner chooses to count the number of library visitors every day. They can then use a chi-square goodness-of-fit test to compare the library’s assumed attendance to its observed attendance. With the additional information, they can better manage the library and increase revenue.
Let’s implement this test on a dataset and solve some problems using python
Implementing chi-square test
In python, the scipy library offers a stats module under which we can find all the chi-square test-related attributes.
Let’s check the independence of categorical variables
import pandas as pd
import numpy as np
import scipy.stats
from scipy.stats import chi2
data=pd.read_csv("aug_test.csv")
data[:5]
data.shape
(2129, 13)

To check the dependency of interested categorical variables need to create a contingency table because the chi-square test could only be performed at tables.
ct_table_ind=pd.crosstab(data["education_level"],data["major_discipline"])
print('contingency_table :\n',ct_table_ind)

Checking the dependency between the education level of employees and their graduation degree. So the contingency table is made for them and it looks like the above image.
Now this table is an input in the chi-square function offered by spicy. This function will calculate the test statistics value, p-value, degrees of freedom and expected values.
chi2_stat, p, dof, expected = scipy.stats.chi2_contingency(ct_table_ind)

print(f"chi2 statistic:     {chi2_stat:.5g}")
print(f"p-value:            {p:.5g}")
print(f"degrees of freedom: {dof}")
print("expected frequencies:\n",expected)


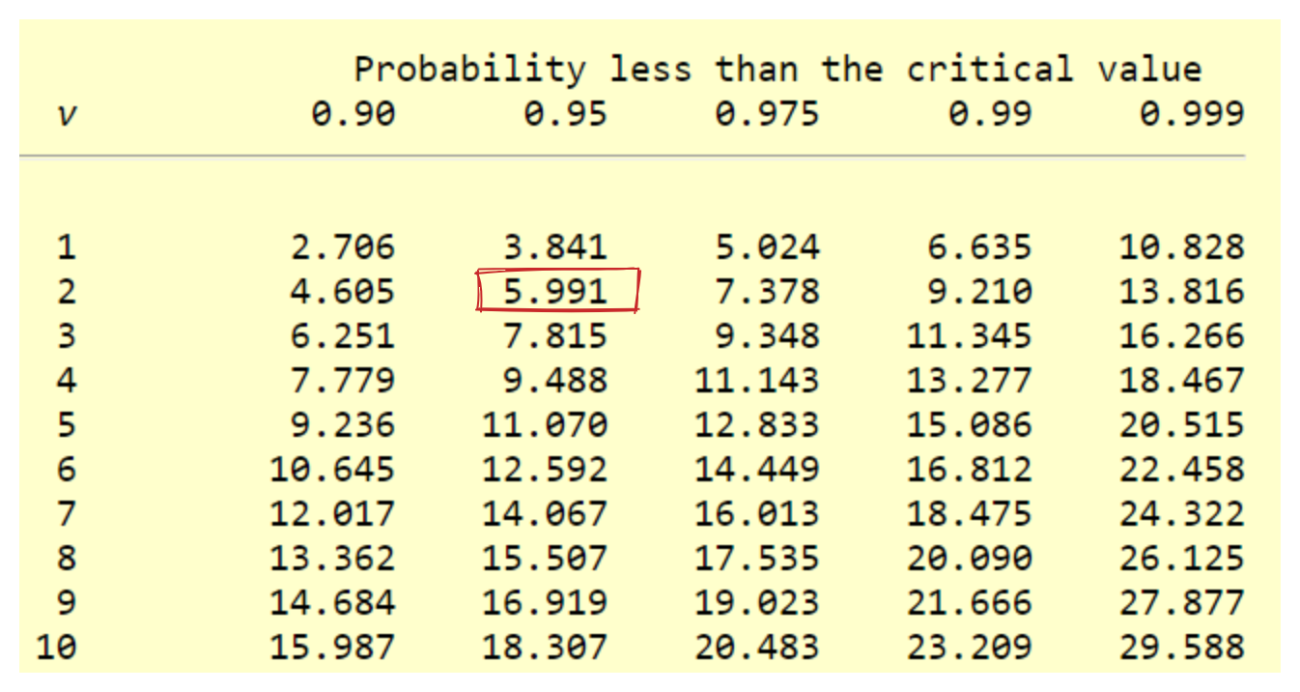
The critical value for the chi-square test with a degree of freedom of 10 and alpha 0.05 is 18.307. Since the test statistic (18.576) exceeds the critical value the null hypothesis is rejected. Therefore, the education level and the graduation degree are dependent on each other.
Let’s check the goodness-of-fit of gender and relevant experience. In this test, the chi-square will fit one categorical variable to a distribution. The process is the same as the above: create a contingency table and use the formula but in this let’s do it from scratch rather than directly applying the contingency chi-square function.
ct_table=pd.crosstab(data["gender"],data["relevent_experience"])
print('contingency_table :\n',ct_table)

Now calculate the observed and expected values and degrees of freedom
Observed_Values = ct_table.values
print("Observed Values :\n",Observed_Values)

ev=scipy.stats.chi2_contingency(ct_table)
Expected_Values = ev[3]
print("Expected Values :\n",Expected_Values)

no_of_rows=len(ct_table.iloc[0:3,0])
no_of_columns=len(ct_table.iloc[0,0:2])
df=(no_of_rows-1)*(no_of_columns-1)
print("Degree of Freedom:",df)

We are all set to calculate the chi-square static value
chi_square=sum([(o-e)**2./e for o,e in zip(Observed_Values,Expected_Values)])
chi_square_statistic=chi_square[0]+chi_square[1]
print("chi-square statistic:",chi_square_statistic)


The critical value for the chi-square test with a degree of freedom of 2 and alpha 0.05 is 5.991. Since the test statistic (10.861) exceeds the critical value the null hypothesis is rejected. Therefore, gender and relevant experience have a significant variation in the distribution. This could be concluded that there is a substantial dependency of gender on relevant experience according to the data.
Conclusion
Chi-square is the test for understanding the relationship between two categorical variables. One can understand whether the dependency and fitness of categorical variables are related to others. With this hands-on implementation, we understood the chi-square test and when to use chi-square.


