Independent Component Analysis (ICA) is a machine learning approach in which a multivariate signal is decomposed into distinct non-Gaussian signals. It focuses on independent sources. Since the mixing processing is unknown, ICA is commonly used as a black box. Unlike principal component analysis, which seeks to maximize data point variance. In this article, we will understand Independent Component Analysis (ICA) and compare it to the Principal Component Analysis (PCA). Following are the topics to be covered.
Table of contents
- A brief introduction to ICA
- Difference between PCA and ICA
- Working of ICA
- Restrictions of ICA
- Dimensionality reduction using ICA
Let’s start with a high-level understanding of Independent Component Analysis (ICA).
A brief introduction to ICA
Noise has a large influence on recorded signals and cannot be removed from measurements. It is difficult to record a clean measurement since source signals are always contaminated by noise and other independent signals supplied by other sources.
As a result, the measurements might be characterized as a compilation of several independent sources. Blind source separation is the process of separating these mixed signals (BSS). The word blind denotes that the source signals may be separated even if little information about them is available.
The Independent Component Analysis (ICA) approach attempts to identify or extract sound from a single item despite the presence of other noises in the surroundings.
ICA has been used to extract source signals in a variety of applications, including medical signals, biological tests, and audio signals. When ICA may remove or maintain a single source, it is also termed a dimensionality reduction algorithm. Some signals can be filtered or deleted during this activity, which is also known as a filtering operation.
FastICA, projection pursuit, and Infomax are only a few of the ICA algorithms. These algorithms’ main purpose is to extract independent components using the methods outlined below.
- Increasing nonGaussianity
- reducing mutual information
- The method of maximum likelihood (ML) estimation
Difference between PCA and ICA
| Independent Component Analysis (ICA) | Principal Component Analysis (PCA) |
| ICA optimizes higher-order statistics such as kurtosis. | PCA optimizes the covariance matrix of the data which represents second-order statistics. |
| ICA finds independent components. | PCA finds uncorrelated components |
| ICA can extract independent sources which are independent of the higher-order correlations. | PCA can extract independent sources when the higher-order correlations of mixture data are small or insignificant |
| It does not emphasize the components’ reciprocal orthogonality. | It focuses on the major components’ mutual orthogonality. |
| It decomposes the mixed signal into the signals of its separate sources. | It decreases the dimensions to avoid the overfitting issue. |
Working of ICA
Consider yourself in a podcast room with three individuals speaking at the same time. Three microphones have been placed at various spots. The microphones provide three recorded time signals with varying amplitudes and time indices. Each of these recorded signals is a weighted sum of the three speakers’ speech signals. These characteristics, when combined with some factors that rely on the distances between the microphones and the speakers, might be described as a linear equation.
For the time being, we will exclude any time delays or any additional components from our basic mixing model. Only if the mixing parameters are known can the linear equation be solved easily by inverting the linear system. So the question of how to solve the linear equation arises.
The method of tackling this challenge would be to estimate both the mixing parameter and the signal itself using the information on the statistical features of the signals. If minimizing the mutual information of signals will result in statistical independence of speech signals at each time instant suffices. Independent component analysis may be used to estimate the mixing parameter based on their independence, allowing the three original signals to be separated from their mixes.
The qualities of mixed signals are as follows
- Independence: If the source signals are not independent, neither are their mixed signals. This is because the source signals are shared by both combinations.
- Gaussianity: the histogram of mixed signals is either bell-shaped, Gaussian, or normal. The source signals must be non-Gaussian, which is a key constraint in ICA. As a result, the ICA model is unable to estimate Gaussian independent components.
- Complexity: As the preceding example shows, mixed signals are more complicated than source signals.
Restrictions of ICA
- The statistical independence of the components is assumed. This assumption is the principle of working of ICA. When one variable cannot extract any information from another, the variables are said to be independent. Probability densities can be used to define independence. Surprisingly, this assumption is all that is required to determine that the model can be approximated. This is why ICA is such a strong approach with numerous applications.
- The independent components must have non-gaussian distributions, i.e. they cannot be normally distributed. Higher-order cumulants are zero for gaussian distributions, yet such higher-order information is required for ICA model estimation. If the observed variables have Gaussian distributions, ICA is virtually impossible.
Dimensionality reduction using ICA
In this implementation, we will use ICA as a dimensionality reduction for the high dimension data. The data is said to be high dimensional when the number of observations is much lesser than the number of features.
Importing necessary libraries:
import pandas as pd
import numpy as np
from sklearn.decomposition import FastICA
import matplotlib.pyplot as plt
As mentioned in the above explanation sklearn offers FastICA for dimensional reduction and analysis.
Reading dataset:
df=pd.read_csv("twitchdsano.csv")
df[:8]
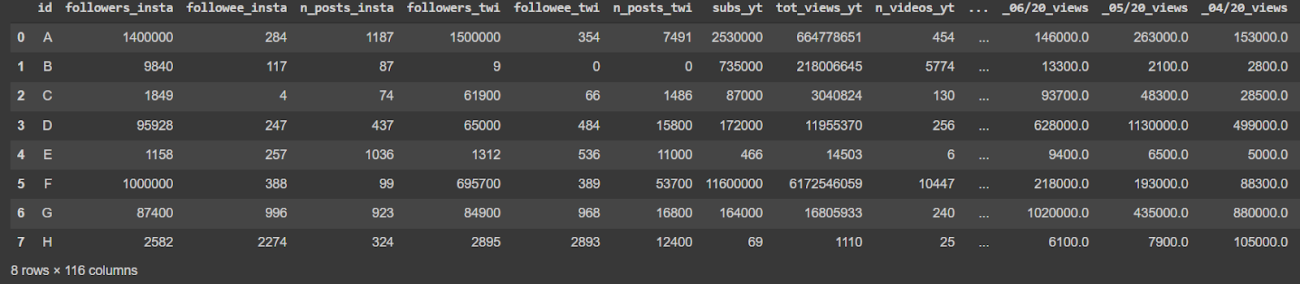
df.shape
(30, 116)
There are a total of 30 observations and 116 features. So we can say the data is high dimensional.
Using ICA to reduce the dimensions:
transformer=FastICA(n_components=10,whiten='unit-variance')
Here the n_components parameter defines the number of components to be considered. The whiten parameters alter the data such that possible correlations between its components are erased. This results in covariance of 0 and a variance of 1 for each component. Now let’s fit and transform the high dimensional data.
df_new=transformer.fit_transform(df_utils)
df_new.shape
(30, 10)
From 116 features it has been reduced to 10 features.
Plotting the components
ReducedData=pd.DataFrame(data=df_new,columns=['IC1','IC2','IC3','IC4','IC5','IC6','IC7','IC8','IC9','IC10')
plt.figure(figsize=(15,8))
plt.scatter(x=ReducedData['IC1'],y=ReducedData['IC2'],label="Component 1&2")
plt.scatter(x=ReducedData['IC3'],y=ReducedData['IC4'],label="Component 3&4")
plt.scatter(x=ReducedData['IC5'],y=ReducedData['IC6'],label="Component 5&6")
plt.scatter(x=ReducedData['IC7'],y=ReducedData['IC8'],label="Component 7&8")
plt.scatter(x=ReducedData['IC9'],y=ReducedData['IC10'],label="Component 9&10")
plt.legend()
plt.show()

Conclusion
Independent Component Analysis (ICA) identifies hidden elements from data by converting a group of variables into a new set of variables that are maximally independent. To achieve this objective, ICA employs a measure of non-Gaussianity. Principal Component Analysis (PCA) and Independent Component Analysis (ICA) have different purposes; the former compresses data while the latter separate data. With this article, we have understood the difference between ICA and PCA, and implemented ICA for dimensionality reduction.