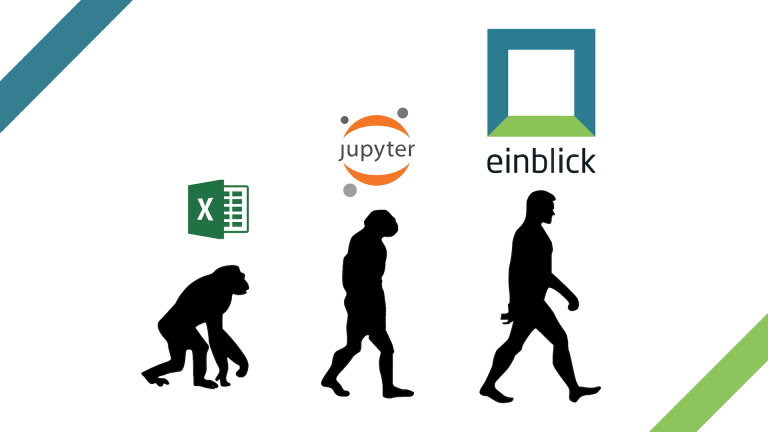
Data-backed decisioning is a bottleneck for nearly every company today. On the one hand, there is not enough data science bandwidth, and technical roles are hard to fill. But on the other hand, most data science teams’ existing tools and programming languages are too technical for non-experts. The result is that it takes too long to answer most common business questions, and many strategic initiatives are decided with Excel or gut instinct rather than data-informed.
A stunning 97.2 per cent of organisations invest heavily in big data and AI. But the question is, are they effectively using data – and corresponding data visualisation?
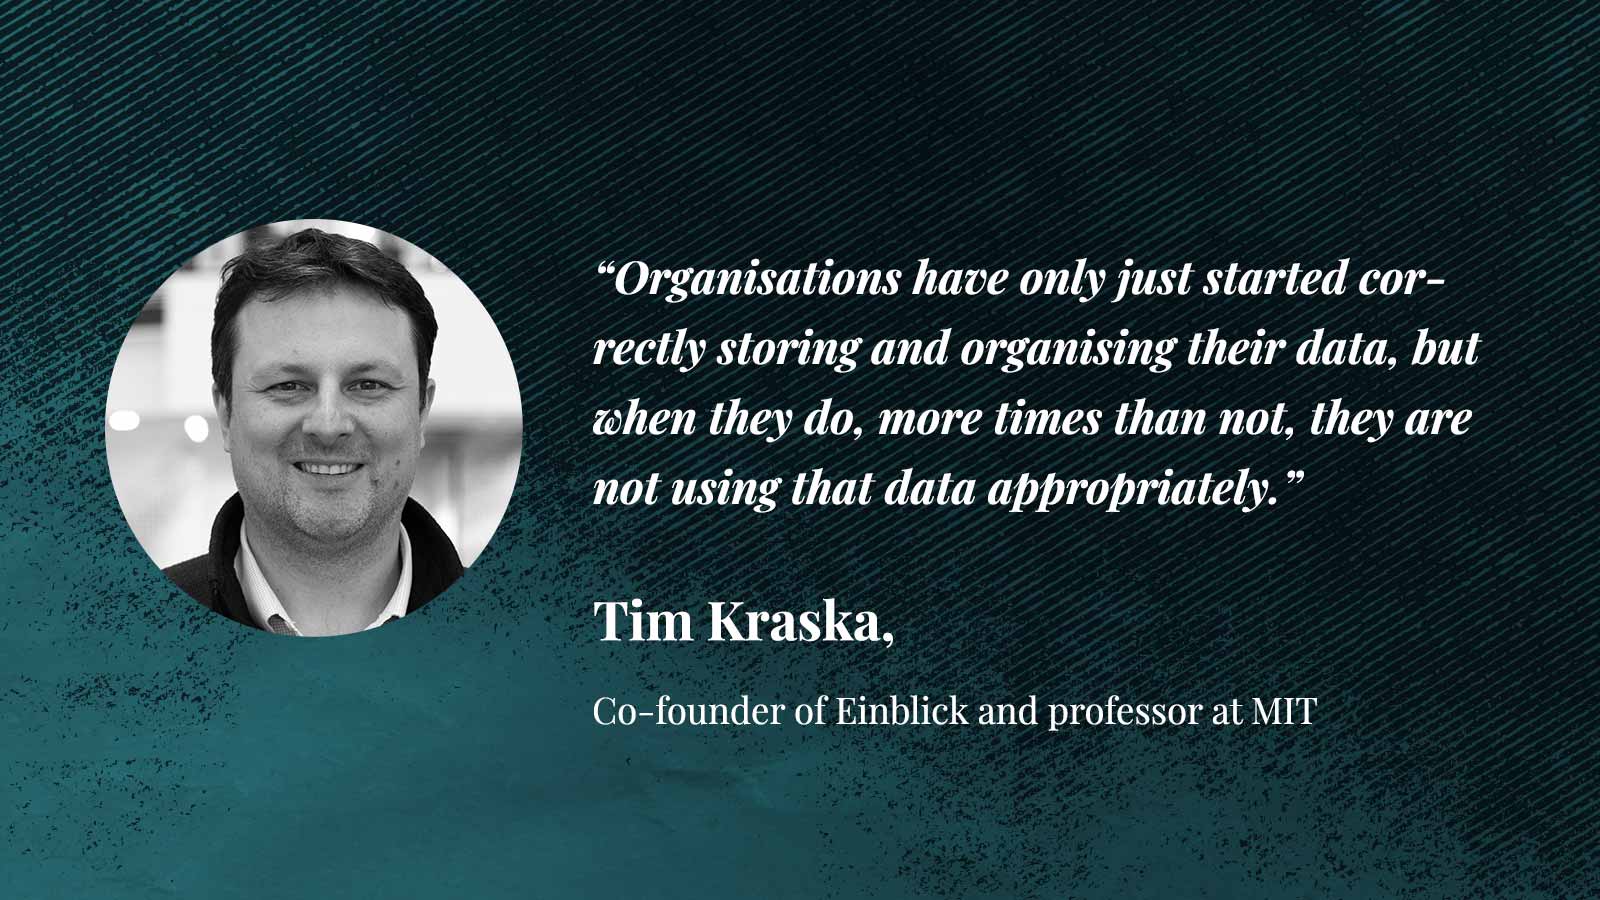
“Organisations have only just started correctly storing and organising their data, but when they do, more times than not, they are not using that data appropriately,” said Tim Kraska, co-founder of Einblick and professor at MIT. Some organisations do not collect enough data, and others collect the data but do not do anything with it. And, there is a slightly more advanced subset of teams that actively derive insights from data but do not necessarily act on the insight or act incorrectly due to lack of experience. This ultimately reduces down into two linked problems that plague almost all organisations.
First, the people within an organisation who use data analytics tools aren’t close enough to the business problems that data might solve. Even if data scientists have access to data from different lines of business, subject matter expertise is important to putting data to good use. The desired outcome of the stakeholder business line is frequently lost in translation. Other times, data science analysis becomes a series of hindsight exercises since analysis is conducted without a clear understanding of forward-looking business strategy.
Second, there has been a huge barrier to entry for the domain expert. For example, data scientists cannot share traditional notebooks with their stakeholders. On the other hand, no code drag-and-drop tools might be able to make visuals but cannot fully overcome non-data scientists’ unfamiliarity with statistical modelling or data transformation. And these no-code tools are also unwelcoming environments to coders who want to do more, and rather than being “common ground,” prove to be just another silo. One way to solve this is to simply reverse the equation – bringing one new skill (data science) to departments across the enterprise.
“What is missing is a tool that facilitates a data discussion for a domain expert via a friendly visual interface with explainability, plus on that same canvas exists a “code cave” interface familiar to a data scientist such as a notebook or IDE. Furthermore, all of this needs to run on a nimble but powerful computation engine to handle any amount of data or user interactions,” said Kraska.
This is where data collaboration and data visualisation tool Einblick come into play. It rethinks the design of data workflows, which traditionally focused on linearly solving problems as an individual contributor. Instead, it creates a multiplayer digital whiteboard that supports drag-and-drop interactions, no code data science operators, and Python. “By focusing on collaboration first and removing the need to code (though you can if you want), teams can jump into Einblick together and create a prototype solution in less than an hour,” said Kraska.
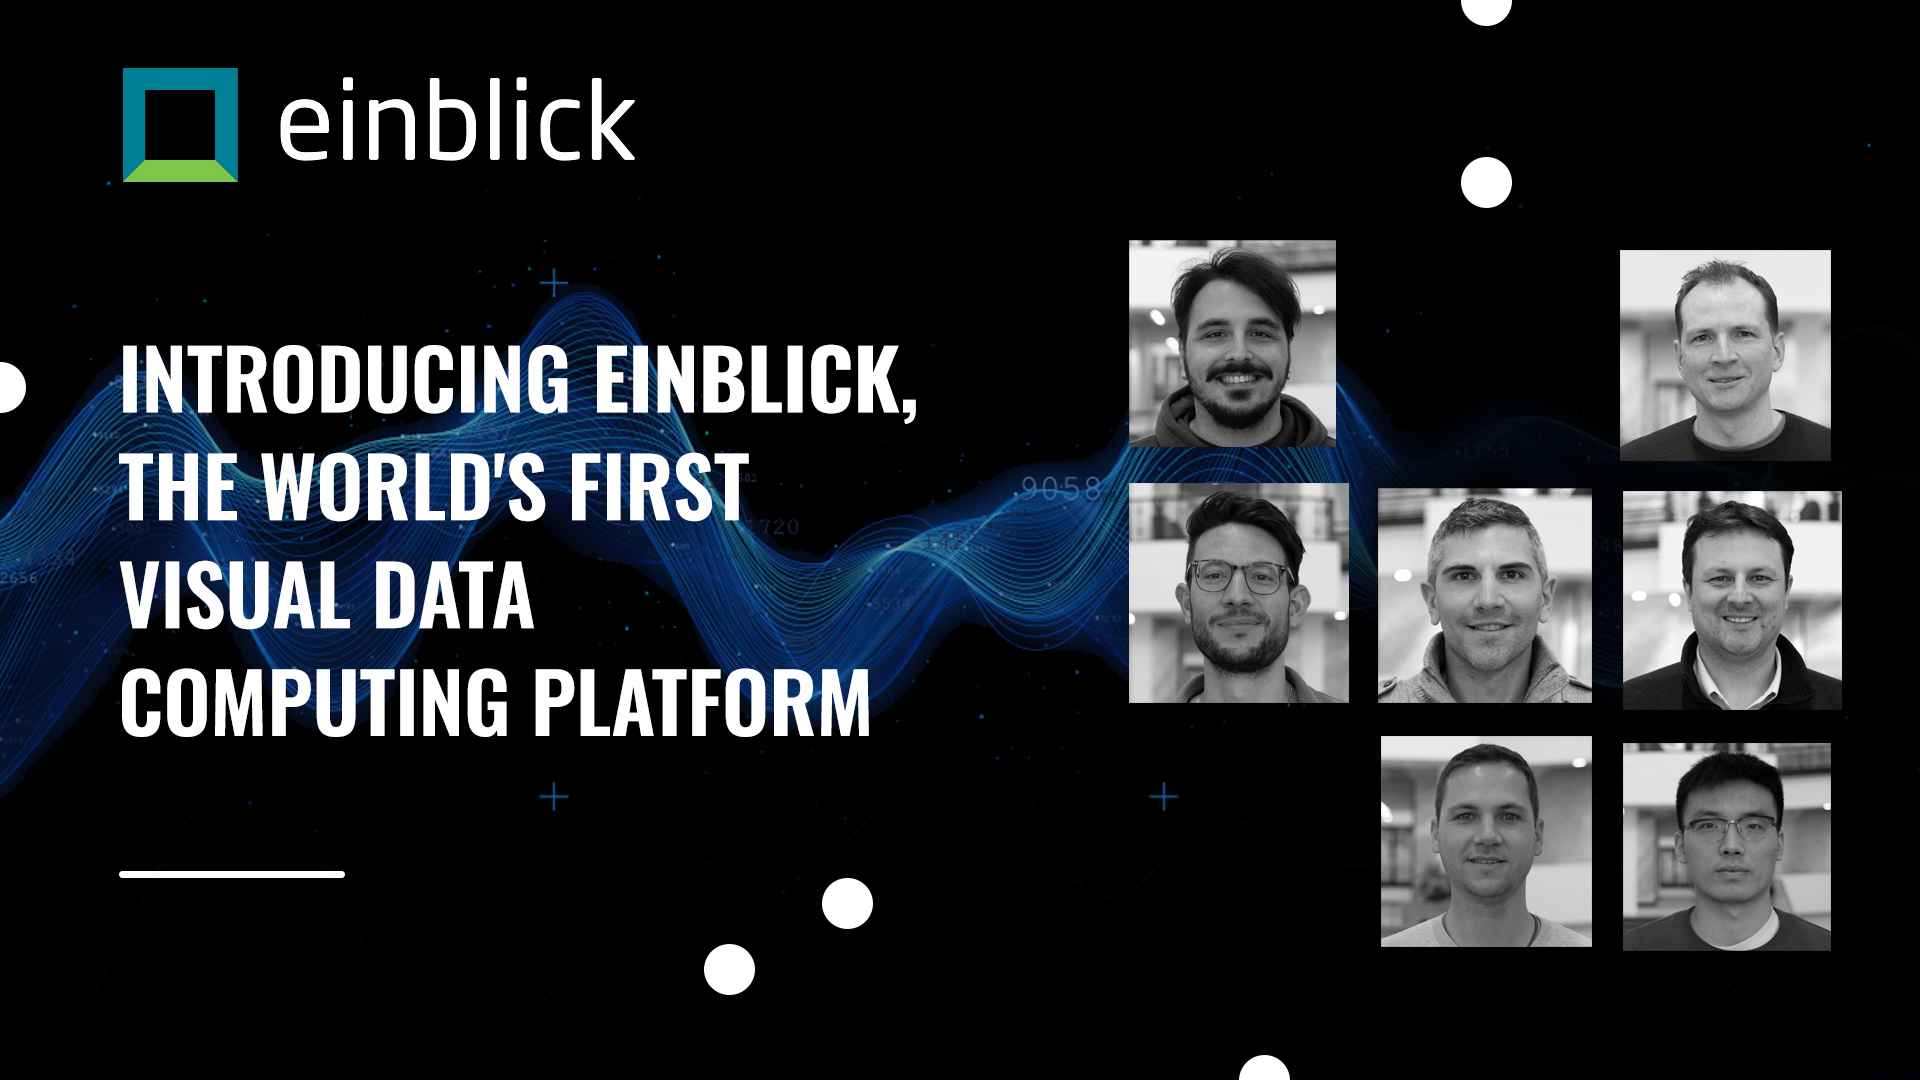
Founded in 2019, Einblick Analytics is an MIT and Brown University spin-off. Its co-founders include Benedetto Jacopo Buratti, Emanuel Zgraggen, Philipp Eichmann, Kraska, and Zeyuan Shang. The company aims to enable everyone to make an impact through data, not opinions.
Team Einblick has been developing its technology for over five years now at MIT and Brown University, winning several prizes, including DARPA’s D3M Automated Machine Learning competition. Now, Einblick is commercialising this research.

The tech behind Einblick
Einblick has been built on the idea that live collaboration is possible and code is optional. To make both of these conditions true, the team rethought the structure of analytics software from the ground up and developed several innovations, from the computational engine to UX.
While most analytics platforms allow for sharing code or copying workflows, Einblick is the only platform that enables live conversation and multiplayer mode on the canvas. This means that two stakeholders can brainstorm whiteboard hypotheses and move rapidly through output creation and debate. “When one stakeholder is more technical, they can ‘show’, not ‘tell’, the other user how to debug,” said Eichmann.
“But, to empower this, the output must be able to render in near real-time, at the speed of thought. So, we created an approximate progressive computation engine, which delivers the best guess of the completion and updates visuals in batches – but this whole time, the users can be discussing results on the visual canvas and continuing to build out the workflow,” explained Eichmann.
Team Einblick has deployed various no-code operators with the engine in place, including AutoML, alongside a wide range of other associated data mining tools like key driver analysis. This way, analyst teams (especially those not already expert data scientists) can build towards a complete analysis rather than jumping headfirst into an ML solution.
“So, to put all the pieces together, an optional code workflow with real-time responsiveness lets two less technical users jump into a foreign dataset together, discuss what they are seeing, rapidly build a prototype ML model, and then quickly iterate on that,” said Eichmann.
Einblick vs the world
Presently, we are reaching a new horizon in data analytics, and prescriptive analytics is becoming more and more important to make data-driven decisions. However, despite progress in democratising data acquisition and access, making data-driven decisions remains a significant challenge for teams without deep technical expertise.
Descriptive analytics tools such as Tableau, Qlik, Thoughtspot, etc., are helping domain experts understand past data. It is arguably the foundation of any business. However, existing tools for data analytics beyond core business intelligence that was designed decades ago still present a high bar for domain experts, and removing this requires a fundamental rethinking of both interface and backend.
At Einblick, an MIT and Brown spin-off based on the Northstar project, the team has been building the next-gen analytics tool in the last few years. To overcome the flaws of existing processing engines, they introduced Davos, an Einblick novel backend. The way it works is that Davos combines aspects of progressive computation sampling and approximate query processing with a specific focus on enhancing user-defined operations. In addition, it optimises multi-tenant scenarios to promote collaboration.
“With the increasing popularity of Python notebooks, users sometimes would like to integrate their custom operations into the system – i.e., user-defined operations (UDOs),” said Kraska.
More recently, data science tools like Alteryx, DataRobot, KNIME, etc., made predictive analytics more accessible. These tools, sometimes called self-service ML or data science tools, are often quite different from the business intelligence (BI) tools as they aim to create the best possible model for a given scenario.
The way it works is that instead of dialogue-based interfaces, they are usually developed on top of workflow engines, where individual operations/tasks are represented by boxes, which the user then connects to form an entire ML pipeline. This interface makes it easier to understand how the data ‘flows’ from its source and raw format to the final model to create a prediction eventually.
This is important for ML as different ways of cleaning and encoding data can profoundly impact the final accuracy of the model. “However, the downside of workflow engines is that they do not provide any immediate feedback. The user has to press the ‘play’ button after curating the pipeline, which starts the computation of the composing workflow. This might take hours until the first result is produced. While some tools try to solve this issue by providing more immediate feedback for parts of the pipeline through specialised interfaces (for example, hyperparameter tuning), they ensure that the user still sees and understands the whole process,” explained Shang.
The team believes that Einblick packages all of the above into a browser-based SaaS offering, bridging the gaps the tools mentioned above are riddled with.
Collaboration made easy
“To truly democratise data science, we need to fundamentally change the way people interact with data,” said Kraska. Yet, astonishingly, the interfaces people use to analyse data have not changed since the 1990s, and most analytical operations/tasks are still performed using scripting languages and/or SQL, remarked Kraska.
Lately, there have been trends in the choice of programming language (example: from PERL to Python), algorithms (from neural networks to statistical learning and back to neural networks), and database technology (SQL, NoSQL, and Not Only SQL). “Yet, people still primarily interact with data through scripts and SQL-like languages, with up to hour-long wait times for results,” added Kraska.
He said people should stop holding onto the past; rather, we should start designing systems for how data science should be done in ten years. “To date, interactive whiteboards are just better conferencing systems, but they have the potential to be much more. We want to put them at the core of every meeting involving numbers, from discussing sales figures to understanding the customer base better and building predictive models,” said Kraska.
“We envision a collaborative environment, where data scientists and domain experts can work together to arrive at primary solutions during a single meeting – solutions which can then, if necessary, be redefined offline,” he added.
This is in contrast to the current dreadful way data scientists and domain experts interact – emphasised Kraska – meetings after meetings to find a common base before real progress is made. “Consequently, to foster collaboration and results, the system has to provide a visual interface because co-programming Python with a CEO is simply not an option,” he added.
Furthermore, Kraska said that they want to enable domain experts to build models independently without the help of a data scientist. Thus, the UX on a domain expert’s laptop should be similar to that on an interactive whiteboard and feature a virtual data scientist who keeps an eye over the process and prevents any major mistakes from happening.
“Interestingly, by putting the user experience first, we not only found that existing systems do not work in this setup, but we also ended up designing a system very different from one we would have created using a systems-first approach,” said Kraska.
How is Einblick different?
“While systems like Tableau are a step in the right direction, offering a visual interface for data exploration, they lack support for creating more sophisticated outputs, like machine learning models. In our work to make data science more accessible, we saw user experience as a crucial component,” said Zgraggen. By combining a visual, collaborative front end with the capability to run end-to-end data science workflows, Einblick has created something completely new. And from a price comparison perspective, Einblick is more affordable with its new freemium SaaS offering that allows most starting users to access powerful ML and data mining tools for free.
Deploy ML models in a blink
Currently, Einblik has about 100 customers spread across industries and the globe. For instance, at one of its customers in the automotive segment, several different non-technical operations managers used Einblick to build different machine learning models. Some of the deployed solutions include a predictive model which proactively flags 80 per cent of potential supply chain issues. Other models improve workforce retention by identifying signals of attrition and using targeted consumer incentives to drive retail sales at dealerships.
Well, there is more. How is Einblick able to onboard new customers?
“There is no one-size-fits-all solution for technical onboarding. Our philosophy has been to guide individuals through basic software mechanics and teach core data science concepts. Outside of the software, we have been starting a ‘Data Science 201’ series of instructional videos and blogs to help folks cross the boundary to answer tough questions,” shared Kraska.
In other words, Einblick has upped its game in terms of in-app help, with expert panellists to guide users through the first few minutes. Additionally, they have a workspace where side-by-side, there is an example, a video demo, and space to ‘do-it-yourself.’
“Outside of the core onboarding, it is important to ensure that data science is interesting to folks,” said Kraska. In line with this, the Einblick team has started a series called ‘Bring Your Own Data.’ Here, they ask someone who might be a domain expert but is less technical to build out an analysis with them. “Using a wide array of examples and showing the conversations that should be happening, we hope that people learn without even realising they are being asked to learn,” added Kraska.
The Future is Einblick
Team Einblick said that it would continue to build out its integrations portfolio, both from a data source and MLOps perspective. For instance, recently, they have added the ability to connect to Databricks instances from the ingest side and added the ability to embed Einblick workspaces into iframes so they can be deployed anywhere on the internet on the outbound side.
“And always, given the platform’s extensibility features, we will continue to publish new extensions such as our new advanced Time Series Feature Engineering operator, which lets users turn log or IoT data streams into predictive variables for analysis easier than anything else available currently,” said Zgraggen.
Currently, Einblick works with customers in NAM and EU, with prospects in LATAM. “Since the language of analytics is universal, we hope to continue growing across all domains,” said Zgraggen. In addition, he said that they are always looking for good feedback and users who might benefit from usage and data science advice in exchange for being part of Einblick’s user council.
So, what are you waiting for? If Einblick sounds interesting, then get started for free at einblick.ai.


