MITB Banner

Machine Learning CheatSheets: Basic Plots In R

Share

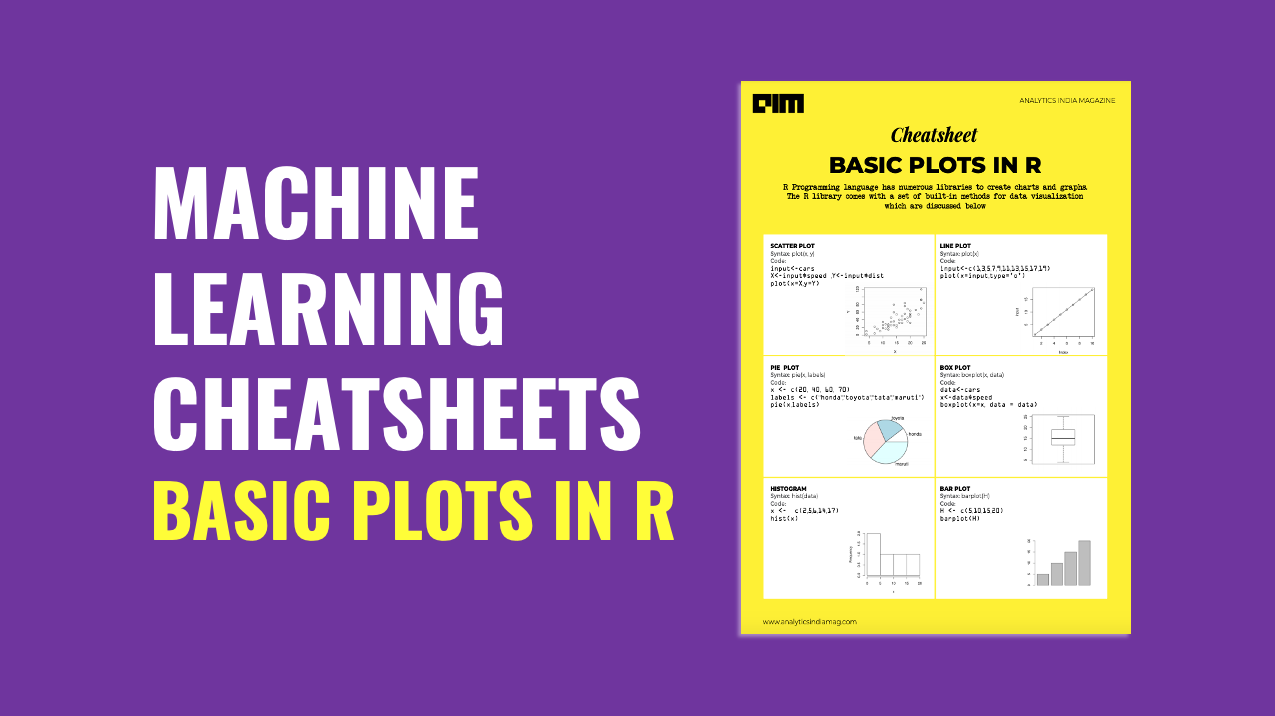
R Programming language has numerous libraries to create charts and graphs.
The R library comes with a set of built-in methods for data visualization
which are discussed below.

PS: The story was written using a keyboard.
Share
Picture of Analytics India Magazine

Analytics India Magazine

Analytics India Magazine chronicles technological progress in the space of analytics, artificial intelligence, data science & big data by highlighting the innovations, players, and challenges shaping the future of India through promotion and discussion of ideas and thoughts by smart, ardent, action-oriented individuals who want to change the world.
Related Posts

CORPORATE TRAINING PROGRAMS ON GENERATIVE AI

Generative AI Skilling for Enterprises

Our customized corporate training program on Generative AI provides a unique opportunity to empower, retain, and advance your talent.

Upcoming Large format Conference

May 30 and 31, 2024 | 📍 Bangalore, India

Download the easiest way to
stay informed

Subscribe to The Belamy: Our Weekly Newsletter

Biggest AI stories, delivered to your inbox every week.

AI Courses & Careers

Become a Certified Generative AI Engineer

AI Forum for India

Our Discord Community for AI Ecosystem, In collaboration with NVIDIA. 

Flagship Events

Rising 2024 | DE&I in Tech Summit

April 4 and 5, 2024 | 📍 Hilton Convention Center, Manyata Tech Park, Bangalore

MachineCon GCC Summit 2024

June 28 2024 | 📍Bangalore, India

MachineCon USA 2024

26 July 2024 | 583 Park Avenue, New York

Cypher India 2024

September 25-27, 2024 | 📍Bangalore, India

Cypher USA 2024

Nov 21-22 2024 | 📍Santa Clara Convention Center, California, USA

Data Engineering Summit 2024

May 30 and 31, 2024 | 📍 Bangalore, India