MachineHack recently concluded its fourth instalment of the “Visualization is Beautiful” hackathon which showcased some of the best visualisations of the pollution crisis in that India faces today. Out of the 24 participants who came with a solution, two were selected as winners based on voting. Akshay Tiwari and Amardeep Behera took the first and second spots on the leaderboard.
Analytics India Magazine takes a closer look at the winners and the approach that they used for solving the problem.
#1 Akshay Tiwari
Akshay Tiwari started his career with Accenture in 2010 as a Business Objects Developer and has over 9 years of experience in Data Warehousing. He moved to Data Visualisation in late 2013 and has since been working closely with data creating visualisations and analysing them for insights. His introduction to Data Visualisation paved the way for his Data Science journey building insightful visualisations using Advanced Analytics and Predictive Analytics.
Approach
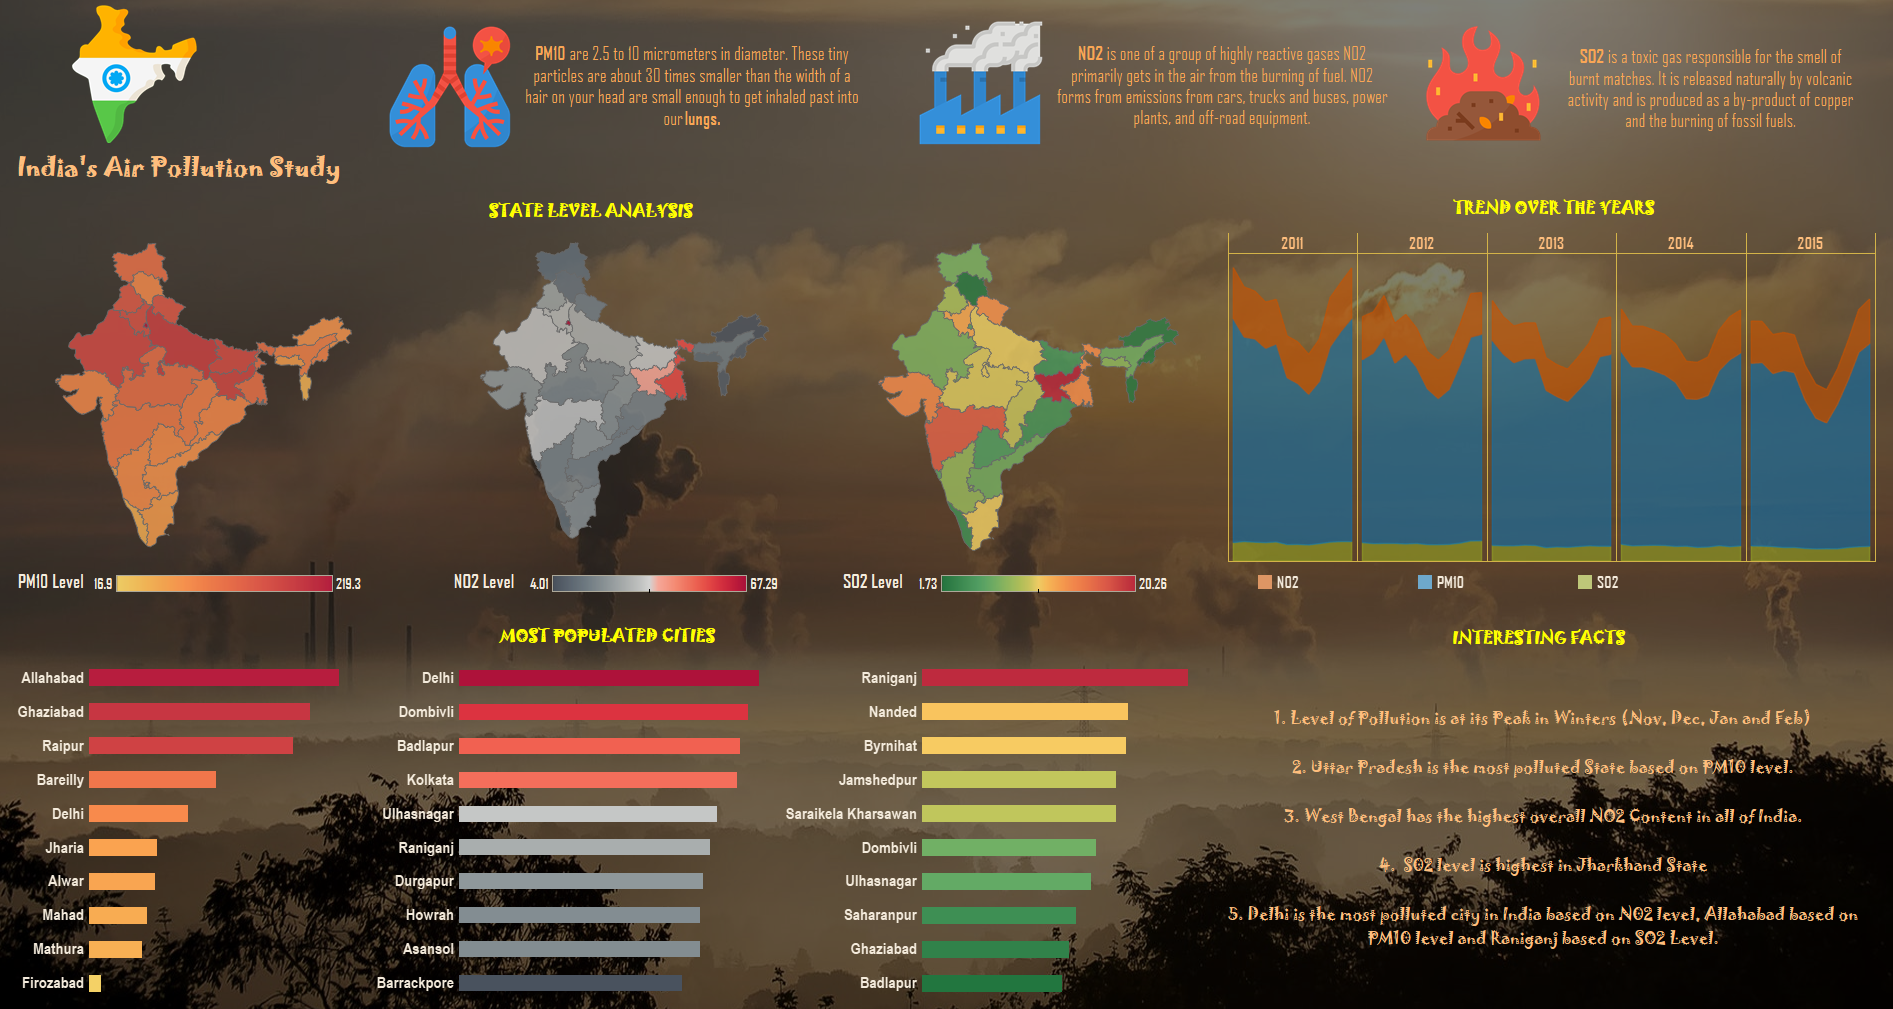
Akshay started with a simple analysis of the data noting down the best ways possible to efficiently plot the data. Since the data contained Geography, he believed that the map was an ideal choice. He studied the features of the data PM10, NO2 and SO2 and came up with a design to merge the key performance indicators with their definitions. He used Tableau to put his ideas and come up with an attractive dashboard.
“MachineHack is an excellent platform to showcase ML, Predictive and Analytical Skillsets.”, he said.
“I am very happy that my effort got recognised and looking forward to participating in other hackathons by MachineHack,” he added.
#2 Amardeep Behera

Amardeep Behera is a Data Engineer Associate Manager at Accenture and has a total of 10 years of IT experience. Having started his career as a BI professional and then grown his expertise as a Data Architect, Amardeep has proven skills in descriptive statistics and data storytelling. He credits his expertise to Accenture leadership and his seniors who have played a vital role in his journey of data science, “their regular guidance and mentoring have helped me excel in my data science journey” he said.
Approach
He started with data exploration and build a foundation for his story. His objective was to find the relationship between different variables of pollution, do a comparative study of those variables and then present the end to end story using the analysis. He used Tableau for preparing the data and building the dashboard.
Amardeep is not new to MachiineHack and has successfully secured third place in MachineHack’s IPL Data Visualisation Challenge.“My overall experience with MachineHack has been very good.”, he said.
“I have been regularly taking part in other hackathon organised by MachineHack. It is an amazing platform for a data engineer professional like me to continuously polish my data science skills and expand my knowledge of data science,” he added happily.