I like to think the germ of the idea for ‘Analytics for Beginners’ or AfB as it is called internally, was sown long before Gaurav (CEO, Jigsaw Academy) ever told me anything about it.
Being from a non-analytics background, I started reading up on analytics only after joining Jigsaw. And wasn’t I amazed! Whether it was my Netflix habit, my Big Basket grocery orders or my discerning (I’d like to imagine so) shopping frenzies on Flipkart or Amazon … all had their basis in analytics. Some of my favorite startups had all evolved from ideas that had their fundamentals rooted in analytics.
But somehow, that amazing discovery didn’t seem to have dawned on most of the people I knew, although they were equally well versed in the various applications of analytics (even if they didn’t know it was from analytics!) today. The closest cousin of analytics – ‘IT’, seemed to have done a far better job in the PR department with even absolutely non-tech people recognizing and responding with great gusto to someone claiming to work in ‘IT’. So why not analytics? Did analytics just not have their marketing & communications department in place?
So there was the idea. A course to raise awareness of what analytics is. Meant for absolutely anybody with no relevant experience whatsoever. Make analytics cool and relatable by using examples, videos and images that even people like me would understand.
An introductory course designed for people like me – essentially, ‘Analytics for Dummies; aka Sushma’. Students, who were willing to possibly put in a certain amount of effort, had basic math and stats skills and who genuinely wanted to know what all the fuss was all about. And who would after the course, then understand how vital data and analytics were, and how it could potentially change the future of every single career domain.
So how did we do that?
Over the course of this post, I’m going to talk about 2 big decisions that made our AfB course look vastly different from any of the other courses that we currently offer – and why this was very important. Firstly, the scripting process, and how the flow of the course was visualized, and secondly, our visual and aural choices. I’ll tell you why we chose the type of animation we did, ditching PowerPoint for a more dynamic form of visual representation, and even using a familiar, friendly voice to help address any math fears potential students may have.
The scripting process for AfB was very traditional film / video script writing, since I did want to the see the course as a story from beginning to end. I was very clear that it should be well constructed, be coherent in what was being covered in each chapter, and very naturally lead to the next topic.
Thomas H. Davenport and Jinho Kim’s Keeping Up with the Quants, Ayres’ Super Crunchers, and Schönberger and Cukier’s Big Data – A Revolution… were great starting points in terms of existing research for the course. The first step was putting down broadly everything that we wanted to cover in the course, what other people had covered in their courses, and what we liked to call ‘hook points’ – not necessarily integral to the course, but stories and anecdotes that would overall lift the quality and appeal of the course. We immediately recognized that this would be the critical ‘visual’ part of AfB, and that the final product would have to contain a large amount of this type of content.
EXTRACT FROM SCRIPT: Where is analytics used, you ask? Where not?! Whether it’s at the movies, on the sports field, when deciding which accessories go best with which laptop, figuring out what TV show you should be downloading next, when choosing your country’s next Prime Minister, or even finding love online … all of these activities today are aided and have been made more efficient by the use of analytics.
During the scripting, the most important thing to keep in mind was ensuring the language always stayed conversational … like a friend speaking to you or teaching you something. This is a departure from standard e-learning courses, where the onus is usually on the student to keep his attention on the course material. The idea usually is that the student requires this learning, and hence will make that extra effort to stay focused on the subject matter. Whereas for AfB, we reversed the idea by constantly cajoling, reminding and at times, even giving the student a visual break so that they never look at the course as a ‘learning exercise’.
The other big decision that was taken was with respect to the case study that we chose to use.
Case studies are the golden eggs of learning – online or offline. MBA courses abuse them to do everything from teaching to problem solving. We knew that we couldn’t escape using one in the course – but could we do it differently? Could we use a case study that genuinely piqued the interest of the non-‘student’?
A few years ago, Gaurav had published what became a controversial post on the best Indian cricketer based on ability to win matches (http://jigsawacademy.com/Beginners-guide-to-logistic-regression-using-r-and-excel/ ). Although we had diligently followed all the analytical rules and regulations, we hadn’t prepared for the multitudes of Dravid, Ganguly and Tendulkar fans who thronged our pages viciously and extremely emotionally agreeing or disagreeing with our findings. And it struck me that that was exactly what we needed for our case study. A topic so interesting that even hardened non-data folks would be drawn in. This was again a massive departure from our existing analytics case studies, where the focus is on trying to find as ‘realistic’ a business problem as possible. I remember joking and arguing that only a case study comparing the box office performances of the 3 Khans – Aamir, Salman and Shahrukh could be a possible substitute for the cricket case study that we were going to use.
But also as part of the case study, we decided to go against the grain and present it differently. We were anyway using the case study to illustrate the steps in the analytics methodology. I.e. use the case study to explain how one should go about any analysis. So what if we decided to let the students arrive at the steps in the process on their own? Let them use common sense and a basic understanding of what we wanted as a result, to help them derive the typical analytical method?
The result was a slightly hotchpotch roundabout way of going about the case study, but an interesting and engaging way of keeping the learner’s attention fully focused on the problem, while challenging them to figure out what they should do next.
In this next section I’ll be talking about our other big decision with regard to AfB, which were our visual and aural choices.
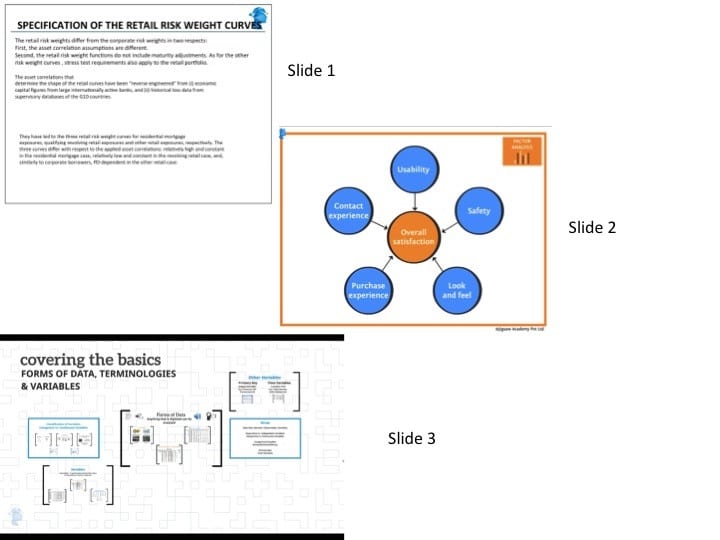
See the difference in the way information is presented here. The first is using a standard PowerPoint format, where the information is usually an echo of what the speaker / instructor is saying. The second is a ‘learning-adjusted’ presentation of information, where the content developer understands that like all good teachers in traditional classrooms, she does not have to have every bit of information on the blackboard. Key points, diagrams, pneumonics, focus words, maps are all that a student needs to reiterate the core messaging given by the teacher. These are learning aids that help underline the ‘understanding’ by the student – especially true when a concept or an idea is being taught. The last frame is using dynamic aids, pictures, possibly even videos when one wants to draw relationships between different concepts or ideas, where the words are not as important as gaining an overall understanding of an issue.
We decided to use Prezi instead of our local presentation formats simply because of the dynamism it offers, and how we could seamlessly move between ideas, concepts and topics – at times linking them, and at times not. It also serves as great visual movement for restless eyes that wander on still frames. It also let us zoom out to reveal the whole picture at times, interesting when one was trying to make a larger point about analytics or its implementation.
The other extremely distinctive part of our course is the animation that has been created specifically for AfB. The stories chosen were obviously because of how relevant they would be to an ordinary computer user’s life – whether it was Netflix, OK Cupid or if they were individuals everyone knew about … think Archimedes or Florence Nightingale. These also serve as visual breaks to the content, little breathers where one simply enjoys the anecdote with no pressure to absorb any information or learning from it. Take a look at what I mean: https://www.youtube.com/watch?v=PIXbwxqLCJw&feature=youtu.be
Or look at this example where we ‘relook’ at the old Archimedes ‘Eureka!’ story, and give it an analytics slant.
https://www.youtube.com/watch?v=jp25RyoLcvY&feature=youtu.be
The audio used through the course was also a conscious decision. Since we use professional VO artists for our other courses, we debated a fair bit about how and who should voice this course. We definitely wanted it to sound professional, but at the same time, these learners needed to feel that the person teaching them was someone who could and would actually take some time out in real life to do the same. A certain air of friendliness, warmth, patience and knowledge about analytics was required. So we decided to go with a real voice as compared to a ‘professional’ voice – a decision I feel makes the course feel a lot more accessible and simple.
Currently the course is available on our website, and is being seen as a starter course on analytics (which it is!). We do hope though that more non-analytics professionals come forward to educate themselves about the wonderful world of data. It’s a world that we simply cannot escape from!