Variability in Performance of employees has paramount importance in operations planning for any organization. Basis the analysis that is detailed in the paper we find that even the experienced of the employees have around 30%-40% variability in their efficiency. For better operations planning consistency in the process or employee efficiency becomes paramount. The article discusses the Efficiency and Variability tradeoff & how an organization can derive what is the required Optimum level of “Efficiency and Variability” at a strategic level and how to track & monitor the improvement at the tactical level. The example discussed in the paper has been derived from transaction services operation.
Efficiency here means the time taken to complete a particular transaction basis the time standard. Variability is the movement that is experienced in the efficiency of the employees over a time period. Using two metrics “Efficiency “and “Variability in Efficiency” we derive the concept of
- Consistency curve,
- Optimal level on the curve
- Levels on the Consistency curve for New employees and experienced employees
- Consistency scoring metrics to enable the operations to track the performance in terms of how consistent the team is periodically.
Concept is partly derived from Markowitz Efficient Frontier theory and the framework is designed along that to be used in the field of operations analytics
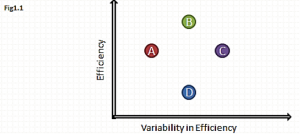 Fig on left details the Efficiency on the Y axis and Variability on X axis for associates working on transaction processes. Complexity of work is assumed to be homogeneous here although the same can be incorporated to calculate efficiency using the Time standards for a particular work type in the below equation.
- Efficiency is defined as=(Time standard to resolve a customer request)/(Time taken to resolve the request)
- Variability in Efficiency=Standard deviation(σ) of (Efficiency) for a time period t
Figure details the Efficiency and variability for four employees A,B,C and D. B is highly efficient but less predictable when compared to A, while relatively A is highly predictable but at the cost of lower efficiency than B.
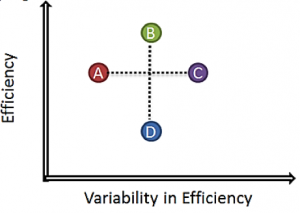 In the fig on left, we can see that A & C have the same efficiency level calculated for the time period t also A is less variable than C and thus more consistent than C. For an Operations manager A would be the person he would go up to in comparison to C given an option.
B &D work at the same level of variability but B is highly efficient than D which means that B is a better performer than D by looking at both the metrics together. The important concept here is that the operations manager should ensure that C improves relative to A by reducing the variability while D having the same level of variability as B should try to move up the ladder in terms of efficiency.
Optimal path of improvement for employees in term of efficiency and variability should be North West direction, operational effectiveness is achieved with improvement in efficiency & decline in variability.
Plot from a sample of operations function: Consistency Curve
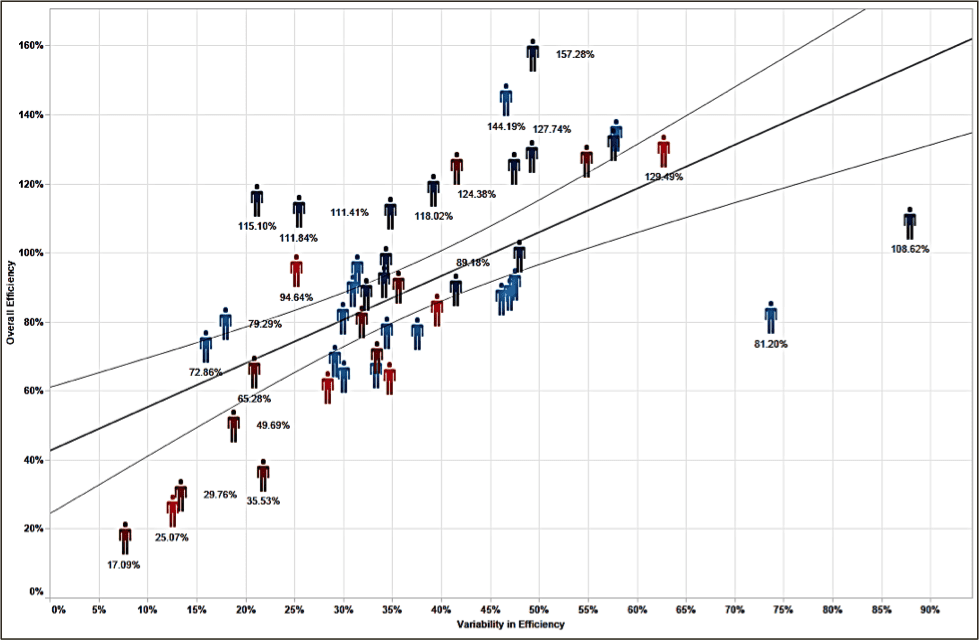
Figure above has been derived from a sample analysis of an operations team handling the transaction operations. Efficiency has been calculated for a time period of 6 months.
Total sample size=40 employees
Time period of analysis (t)=6 months
Data points above reflect the 6 months efficiency and variability in efficiency. Variability in efficiency for an employee is calculated as=
σ(Efficiency(week ’1’), Efficiency(week ’2’)..Efficiency (week ’n’))
In the above graph we can see that there are employees who are highly efficient but highly variable too. This creates inconsistency into the system which makes it difficult for efficient planning of operations as higher levels of variability reduces the probability of achieving the given level of efficiency on a given day or point in time
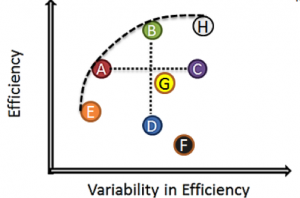 Consistency Curve: Consistency curve is the relative zone that all the employees should try and aim for. The curve will always be concave and is formed by joining the best possible options available at a given level of efficiency and variability.
Consistency Curve: Decision making
Aim of the Operations leads should be to ensure that over a period of time all the employees should try and reach closer to the consistency curve. At what point on the consistency curve they should be would depend upon the current scenario of operations and requirements of the managers at that point in time. The detail of the same is given below in the graph
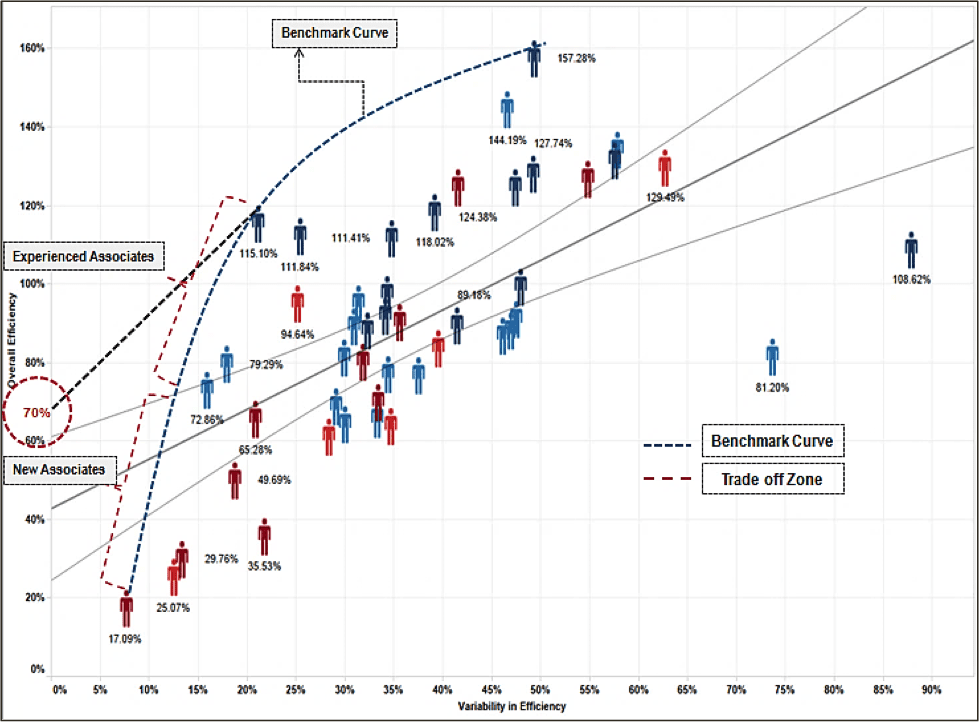 In the above graph we divided the Consistency curve into two sections
- Lower Zone: It is the zone that the new employees are expected to target.
- Middle zone: This is the area that in general the experienced employees are expected to target.
- Upper Zone: Gain in efficiency is coming at the cost of higher variability.
Minimum accepted efficiency (MAE): This is the minimum efficiency on the Y axis that the employees are expected to achieve in any given scenario. In our analysis in the previous graph we have kept that point to be 70% on the Y axis (highlighted in the red circle).
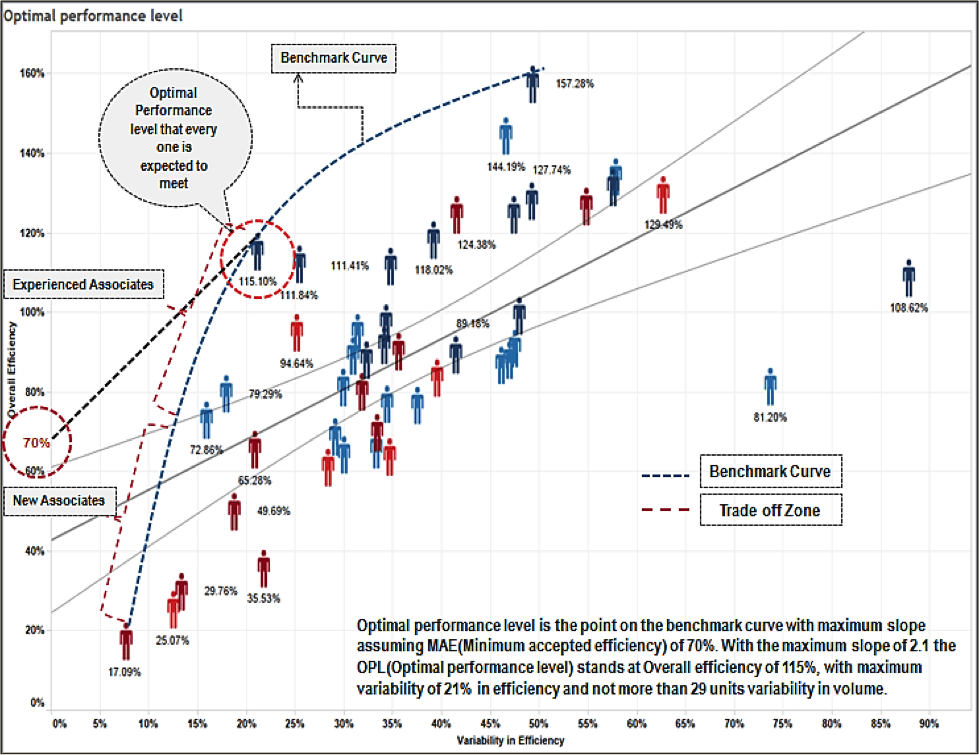
Optimal Performance level: This is the point where the slope of the curve is maximum and the gain in efficiency is maximum for a unit increase in variability. Beyond this point the curve becomes flat and the incremental gain in efficiency comes at a cost of higher variability. In our analysis that point calculated is 115.10% at a variability level of 21%
This is point where the line from MAE (Minimum accepted efficiency) to the curve is tangent. Slope = (Efficiency-MAE)/ σ(Efficiency) Implementation of Consistency curve concept
 Implementation of Consistency curve concept
Next step is to monitor the performance of the employees in terms of how well they are improving in terms of moving towards the North West direction on the Efficiency Vs Variability graph. The idea is to measure what is the incremental gain in efficiency from MAE per unit of variability.
Consistency= (Efficiency-MAE)/ σ (Efficiency-MAE)
Consistency score from the above equation can be calculated for each employee on a weekly or monthly basis.
Any gain in the consistency score on a week to week basis is a sign of improvement and if the score falls it means that the performance has declined.
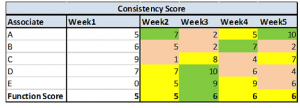 Figure on left gives the hypothetical example of the consistency score of 3 employees X, Y, Z.
- X has been performing really well in both the metrics of efficiency and variability put together that measures the consistency of an employee.
- Y started from a negative zone and has been steadily improving
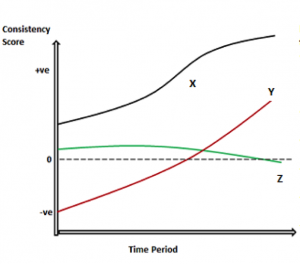 Z has been stagnant and starts declining later which can be because of
- Decline in efficiency at the same variability or
- Increase in variability at the same efficiency level or
- Efficiency could be falling while variability could be increasing.
Recommendation: Transaction services managers should ensure that they define the target zones for their associates on the consistency curve and monitor the same on an ongoing basis. The consistency curve should be updated on a regular basis.