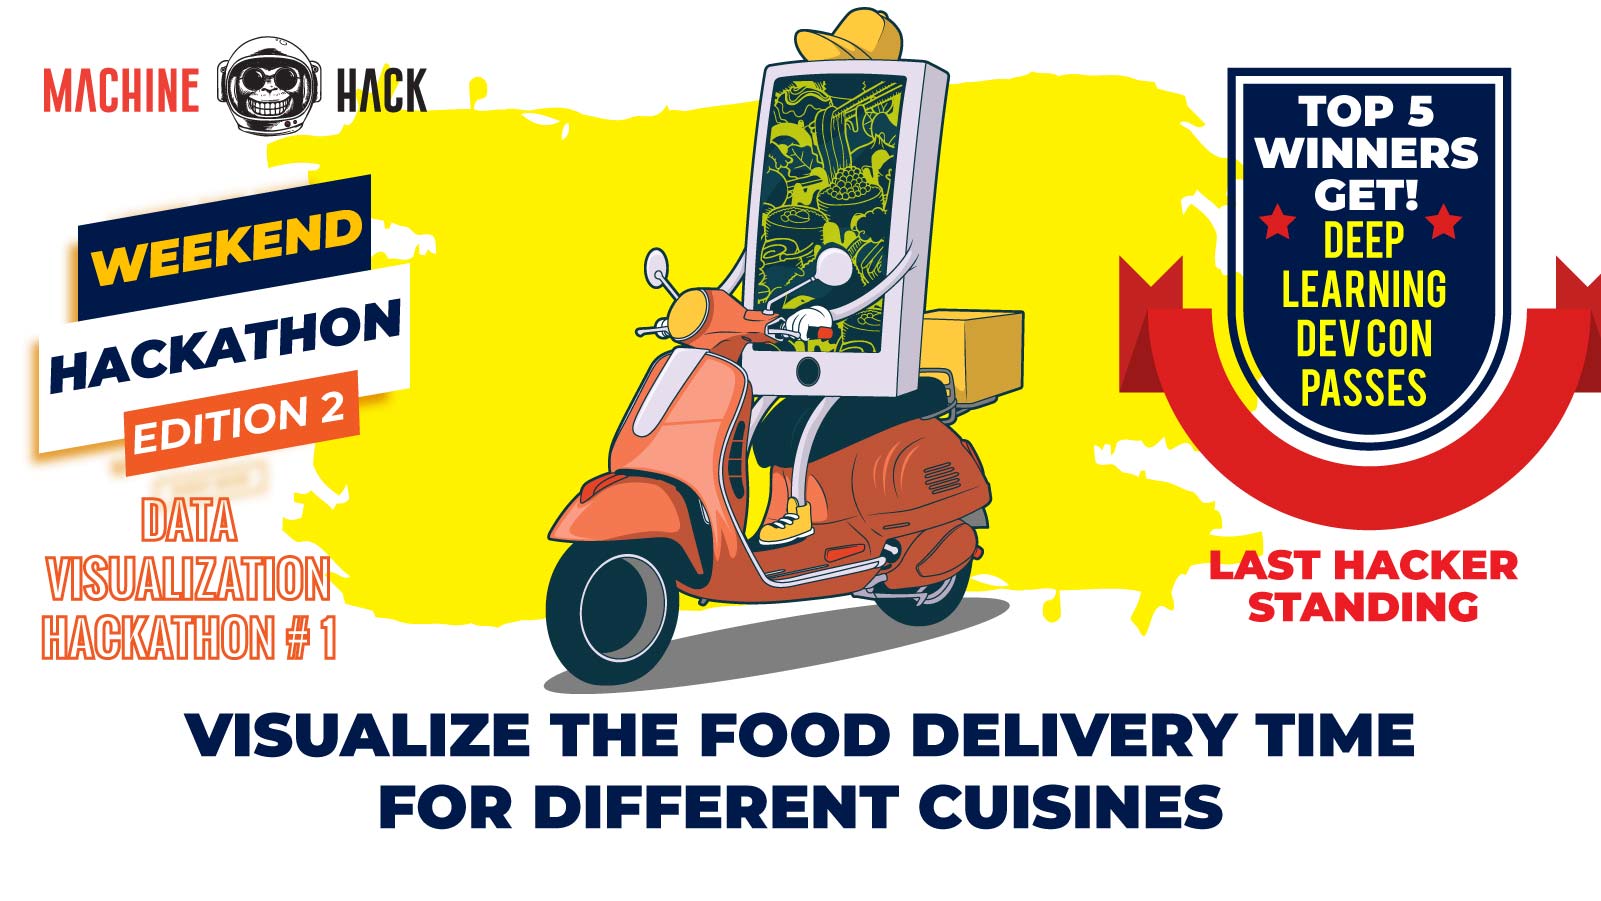
Like every other weekend, MachineHack is back again with another exciting challenge for the data science community as a part of the MachineHack Weekend Hackathon Edition #2 — The Last Hacker Standing. However, this time, it’s all about the art of storytelling. The participants are challenged to visually showcase the food delivery time for different cuisines.
Click here to participate.
Problem Statement
Everybody loves an engaging and amazing story, don’t they? A good story is what connects the dots between the past, the present, and the future. It’s ultimately the story that sells more than the numerous data analyses that we carry out. Otherwise, it’s nothing but an overkill of information.
As a matter of fact, everything that sells is because of the exciting story behind it. And, customising a story for the targeted audience is the most critical thing to do for a business. That’s why this week, MachineHack came up with a challenge that can test out the storytellers in the data science domain.
The best part of this week’s storytelling hackathon is the audience/users’ involvement to decide the winners.
Hurry, Participate Now & Stand a Chance to Win Free Passes to The DLDC 2021!!!
Overview
This week’s problem statement is related to food that we all love — whether it’s Indian Chole Bhature, Italian Pizza, Chinese noodles, or a good Som Tam Salad. However, during the pandemic, with many of us working from home, we have started using food delivery apps for meals, and it’s the delivery time that is critical for working professionals.
In this hackathon, the data science community is asked to work on a data visualisation challenge to analyse and visually showcase the food delivery time for a particular location, say Bengaluru, for different cuisines based on the rating of the restaurants.
MachineHack has created a training dataset of 11095 rows with nine columns, including — Unique ID of restaurants; Location; Cuisine; Average cost; Minimum order; Rating; Votes; Reviews; and Delivery time.
To participate in this hackathon, the challengers need to have a solid understanding of Power BI, Tableau, and relevant visualisation plots such as Box Plot for Outliers. The participants also need to understand aesthetics and the right kind of insights required to decide on the performance.
Submission Guidelines
Please upload all the visualisations in A4 dimension, landscape format, and in PDF only.
The submission limit for this hackathon is one account per participant.
Evaluation Criteria
It is an open platform to share your visualisation skills. Anyone on MachineHack can like your visualisations. Leaderboards are created based on the highest number of likes that a visualisation project receives.
The hackathon will end on 9 Sept at 6:00 PM (IST)
The top three winners will get free passes to the Deep Learning DevCon 2021 (DLDC), scheduled to be held on 23-24 Sept 2021.
Click here to participate.
Dataset Description:
- 11095 rows x 9 columns
- Restaurants (unique ID of restaurants)
- Location
- Cuisines
- Average cost
- Minimum order
- Rating
- Votes
- Reviews
- Delivery time
Skills
- Power BI
- Tableau
- Relevant Visualization plots (for example, Box Plot for Outliers)
- Aesthetics and the right kind of insights


