|
Listen to this story
|
Machine Learning models are frequently seen as black boxes that are impossible to decipher. Because the learner is trained to respond to “yes” and “no” type questions without explaining how the answer was obtained. An explanation of how an answer was achieved is critical in many applications for assuring confidence and openness. Explainable AI refers to strategies and procedures in the use of artificial intelligence technology (AI) that allow human specialists to understand the solution’s findings. This article will focus on explaining the machine learner using OmniXAI. Following are the topics to be covered.
Table of contents
- What is the objective of explainable AI (XAI)?
- Classification of explainable AI
- Explaining the machine learning model with OmniXAI
“Explainability” is a need and expectation that increases the transparency of the intrinsic AI model’s “decision.” Let’s take a closer look at explainable AI objectives.
What is the objective of explainable AI (XAI)?
The primary goal of XAI is to answer “wh” (why, when, what, how, and so on) questions about an acquired response. XAI can deliver reliability, transparency, confidence, information and fairness.
Transparency and Information
By presenting a rationale that a layperson can understand, XAI can improve transparency and fairness. The minimum need for a transparent AI model is that it be expressive enough to be intelligible by humans. Transparency is essential for evaluating the performance and rationale of the XAI model. Transparency can ensure that any erroneous training to model generates weaknesses in prediction, resulting in a large loss in person to the end-user. False training may be used to alter the generalisation of any AI/ML model, resulting in unethical gains to any party unless it is made clear.
Reliability and confidence
One of the most significant aspects that cause humans to rely on any particular technology is trust. A logical and scientific rationale for every forecast or conclusion leads people to prefer AI/ML systems’ predictions or conclusions.
Fairness
Because of the bias and variance trade-off in AI/ML models, XAI promotes fairness and assists in mitigating bias (bias-variance trade off) of prediction during justification or interpretation.
Are you looking for a complete repository of Python libraries used in data science, check out here.
Classification of explainable AI
Explainable AI (XAI) techniques are classified into two major categories of transparent and post-hoc methods. The post-hoc method is further divided based on the data type.
Post-hoc Methods
Post-hoc approaches are effective for interpreting model complexity when there is a nonlinear connection or increased data complexity. In this scenario, the post-hoc technique is a handy tool for explaining what the model has learnt when the data and features do not follow a clear connection.
The statistical and visualisation-based display of feature summaries underpins result-oriented interpretability techniques. Statistical presentation denotes statistics for each characteristic, with the relevance of each feature measured based on its weight in prediction.
A post-hoc XAI approach takes a trained and/or tested AI model as input and produces intelligible representations of the model’s inner workings and decision logic in the form of feature significance scores, rule sets, heat maps, or plain language. Many post hoc approaches attempt to reveal correlations between feature values and prediction model outputs, regardless of the model’s internals. This assists users in identifying the most relevant characteristics in an ML work, quantifying the value of features, replicating black-box model choices, and identifying biases in the model or data.
Local Interpretable Model-agnostic Explanations, for example, extract feature importance scores by perturbing real samples, observing the change in the ML model’s output given the perturbed instances, and building a local simple model that approximates the original model’s behaviour in the neighbourhood of the original samples. Model agnostic and model-specific posthoc techniques are the two types of posthoc procedures. Explainability limitations about the learning method and internal structure of a particular deep learning model are supported by model-specific strategies. To understand the learning mechanism and give explanations, model agnostic approaches use pairwise analysis of model inputs and predictions.
It has been noted that global techniques can explain all data sets, but local approaches are confined to certain types of data sets. Model-agnostic tools, on the other hand, may be utilised with any AI/ML model. In this case, paired examination of input and results is critical for interpretability. Model-specific strategies such as feature relevance, condition-based explanations, rule-based learning, and saliency map were covered in the following sections.
Transparent Methods
Transparent methods such as logistic regression, support vector machine, Bayesian classifier, and K closest neighbour offer rationale with feature weights that are local to the user. This category includes models that meet three properties: algorithmic transparency, decomposability, and simulatability.
- Simulatability refers to the ability to simulate a model that must be executed by a human. The complexity of the model is significant for human-enabled simulation. A sparse matrix model, for example, is easier to comprehend than a dense matrix model because a sparse matrix model is easier to rationalise and perceive by people.
- Decomposability refers to the explainability of all aspects of the model, from data input to hyper parameters and intrinsic computations. These features establish a model’s behaviour and performance limits. Complex input characteristics are difficult to comprehend. As a result of these limits, such models do not fall within the category of transparent models.
- Algorithmic transparency specifies the interpretability of an algorithm from its input of supplied data to its final judgement or categorization. The decision-making process should be transparent to users. The linear model, for example, is considered transparent since the error plot is simple to understand and interpret. The user may understand how the model reacts in different situations by using visualisation.
The transparent model is realised with the following explainable AI techniques.
- Linear/Logistic Regression (LR) is a transparent model for predicting dependent variables that obey the binary variable characteristic. This strategy is based on the assumption of a flexible fit between predictors and predicted variables. The model demands the users to be familiar with regression techniques and their working mechanism to comprehend logistic regression.
- Decision Trees are a transparent technique that meets transparency requirements in a big context. It is a decision-making tool with a hierarchical structure. Smaller size decision trees are simple to simulate. The number of layers in a tree increases its algorithmic transparency but decreases its stimulability. The assembly of trained decision trees is effective to overcome weak generalisation qualities due to their poor generalisation capabilities. The decision tree tool is now less transparent as a result of this change.
- K-Nearest Neighbours (KNN) is a vote-based method that predicts the class of test samples by voting on the classes of the test samples’ nearest neighbours. KNN voting is based on the distance and similarity of instances. The transparency of KNN is determined by the features, parameter N, and distance function used to quantify similarity. A larger value of K has an effect on the model’s simulation by the user. The complicated distance function limits the model’s decomposability and the transparency of algorithmic execution.
- A rule-based learning model specifies a rule that will be used to train the model. The rule can be defined in the simple conditional if-else form or first order predictive logic. The format of the rules is determined by the type of knowledge base. This sort of model benefits from two rules. First, because the rules are written in language words, a user may easily grasp them. Second, it is more capable of dealing with uncertainty than the traditional rule-based paradigm. The amount of rules in the model enhances efficiency without sacrificing the model’s interpretability and transparency.
- Bayesian models are probabilistic models that incorporate the concept of conditional dependencies among a collection of dependent and independent variables. The Bayesian model is simple enough for end users who understand conditional probability. Bayesian models are sufficiently adequate for all three decomposable, algorithmic transparency, and human simulation qualities. The transparency and simulation of the Bayesian model may be affected by complex variable dependency.
Explaining the machine learning model with OmniXAI
OmniXAI is an open-source explainable AI package that provides omni-way explainability for a wide range of machine learning models. OmniXAI can assess feature correlations and data imbalance concerns in data analysis and exploration, assisting developers in swiftly removing duplicate features and identifying potential bias issues. OmniXAI can find essential features in feature engineering by studying connections between features and targets, assisting users in understanding data aspects, and doing feature preprocessing. OmniXAI provides multiple explanations, such as feature-attribution explanation, counterfactual explanation, and gradient-based explanation, in model training and assessment to completely examine the behaviour of a model created for tabular, vision, NLP, or time-series tasks.
This article will focus on the data analysis, feature selection and explaining the regression model with OmniXAI. For this article the data used is related to music, the top 2000 songs listed by Spotify and the problem is to predict the popularity of songs.
Let’s start by installing the OmniX AI.
! pip install omnixai
Import necessary libraries
import pandas as pd
import numpy as np
from omnixai.data.tabular import Tabular
from omnixai.explainers.data import DataAnalyzer
from omnixai.preprocessing.base import Identity
from omnixai.preprocessing.encode import LabelEncoder
from omnixai.preprocessing.tabular import TabularTransform
from omnixai.explainers.tabular import TabularExplainer
from sklearn.model_selection import train_test_split
from sklearn.ensemble import GradientBoostingRegressor
from sklearn.metrics import mean_squared_error,r2_score
Read the data
The developers of omnixai recommend using Tabular to describe a tabular dataset that may be generated from a pandas dataframe or a NumPy array. To construct a Tabular instance from a pandas dataframe, the dataframe, category feature names, and target/label column names must be specified. The “omnixai.preprocessing” package contains various helpful preprocessing routines for Tabular data.
data = pd.read_csv('/content/drive/MyDrive/Datasets/songs_normalize.csv')
data_utils=data.drop(['artist','song'],axis=1)
data_utils['explicit']=data_utils['explicit'].astype(str)

tabular_data = Tabular(
    data_utils,
    feature_columns=data_utils.columns,
    categorical_columns=[ 'genre','explicit'],
    target_column='popularity'
)
For data analysis, build an explanation called DataAnalyzer. In DataAnalyzer, the parameter explainers give the names of the analyzers we wish to use, for example, “correlation” for feature correlation analysis. In the library, data analysis is classified as a “global explanation.” Explain global is invoked with the extra parameters for the specified analyzers to create explanations.
explainer = DataAnalyzer(
    explainers=["correlation", "mutual", "chi2"],
    data=tabular_data
)
explanations = explainer.explain_global()
The Omnix AI uses plotly as the plotter so all the graphs are interactive. Here we are plotting the correlation plot and some plots related to feature importance.


Build a regression model
transformer = TabularTransform(
    target_transform=Identity()
).fit(tabular_data)
TabularTransform is a transform that is specifically built for tabular data. It transforms categorical features to one-hot encoding by default and retains continuous-valued features. TabularTransform’s transform method will convert a Tabular instance into a NumPy array. If the Tabular instance contains a target column, the target will be the final column of the modified NumPy array.
For this article using the Gradient Boosting Regressor model by sklearn
gb_r = GradientBoostingRegressor()
gb_r.fit(x_train, y_train)
pred=gb_r.predict(x_test)
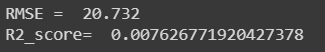
print("RMSE = ",np.round(np.sqrt(mean_squared_error(y_test,pred)),3))
print("R2_score= ",r2_score(y_test,pred))
Explaining the outcomes of the models by initialising TabularExplainer. There are the following needs to be defined while initialising.
- explainers: The names of the explainers that will be used. This article makes use of lime, shap, and PDP.
- data: The information used to start explainers. The training dataset is used to train the machine learning model.
- model: The machine learning model to explain, in this case, a gradient boosting regressor.
- preprocess: The preprocessing function transforms the Tabular instance into model inputs.
- mode: The article’s task type is “regression”.
preprocess = lambda z: transformer.transform(z)
explainers = TabularExplainer(
    explainers=["lime", "shap", "pdp"],
    mode="regression",
    data=tabular_data,
    model=gb_r,
    preprocess=preprocess,
    params={
        "lime": {"kernel_width": 3},
        "shap": {"nsamples": 100}
    }
)
Once the explainer is initialised, run test instances by using these codes.
test_instances = transformer.invert(x_test[0:5])
local_explanations = explainers.explain(X=test_instances)
global_explanations = explainers.explain_global()
Plot the results for visualising the explainability
index=0
print("LIME results:")
local_explanations["lime"].ipython_plot(index)
print("SHAP results:")
local_explanations["shap"].ipython_plot(index)
print("PDP results:")
global_explanations["pdp"].ipython_plot(
    features=['duration_ms', 'explicit', 'year', 'danceability',
       'energy', 'key', 'loudness', 'mode', 'speechiness', 'acousticness',
       'instrumentalness', 'liveness', 'valence', 'tempo', 'genre

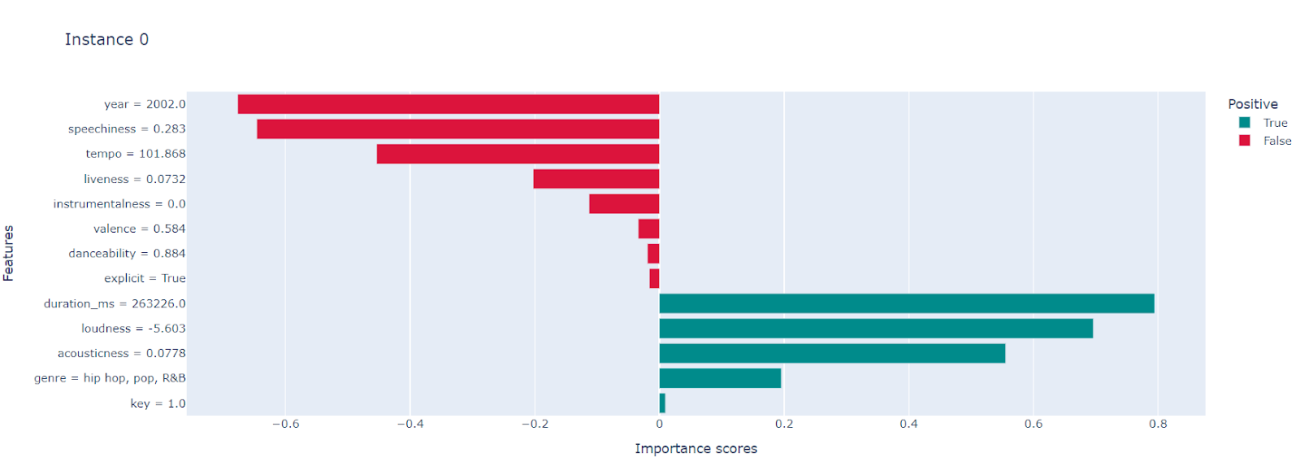

As observed in the LIME test five features (instrumentals, duration, energy, acoustics, and genre) are important and have a positive impact on explaining the result of the learner. Similarly in the Shap test, four features (duration, loudness, acoustics, genre, and key) have more impact on the explainability.
Conclusion
The foundation for explainable AI is transparent ML models, which are only partially interpretable by themselves, and post-hoc explainability approaches, which make the model more interpretable. With this article, we have understood the objective and classification of Explainable AI and implemented explainable AI with OmniXAI.