


Analyzing your data right and selecting the right data are mutually dependent, in fact, this is a key activity to ensure if there are apt data samples coming through, which will eventually lead to success. Getting your data right is not possible as it is user-driven, however, getting the right data for your analysis is absolutely in the control of a data analyst!
Data is often biased, mainly due to the nature of the business, geographies operated, seasonal variations and multiple other factors, you shouldn’t ever let this biasness flow into the data selection sample.
Let’s assume, your business is taking a survey to launch a new product in geography you have never been before, how would you arrive at a decision? What sort of sampling techniques would help? Biasness on survey results might lead to an incorrect decision as we sway around the negativity found in the information, eventually making bad decisions and launching an incorrect product, or possibly the bigger mistake that can further impact the revenue. It is highly important for data analysts to be involved in this process as this part of the activity is picked up with loads of considerations.
There are various sampling techniques out there and statistical measures of inference.
Machine Learning and Predictive algorithms are based on the right data sample, it’s not the model where you fit the problem derives a logical outcome, it’s the step before selection of a right sample that decides!
While it is difficult to get a representative data sample, there are few sample techniques out there to help you.
Let’s consider the same example of the survey business which was conducting a survey to launch a new product in a geographical market with the following scenario – the survey has been taken by 1 million+ individuals across 5 geographies.
The selection of samples against a population is decided on its degree of confidence, typically at 95% of confidence, it’s the ninth partition, which equals 0.1 million observations.
There are quite a number of Inferential statistical measures available that can help you evaluate the right selection of a sample and determine the sample which is fit for consideration around a given population and make generalizations around them. It primarily helps in assessing the likelihood in the most accurate manner and builds confidence around the selection of a data sample for researching a data science problem
Testing that is conducted around an Inferential problem statement is termed as hypothesis testing.
Here in this article, I will focus on the usage of T-Test and its significance in Inferential statistics, It can be used across 2 pairs of samples.
In any sample, it is considered well distributed only if the spread is normal.
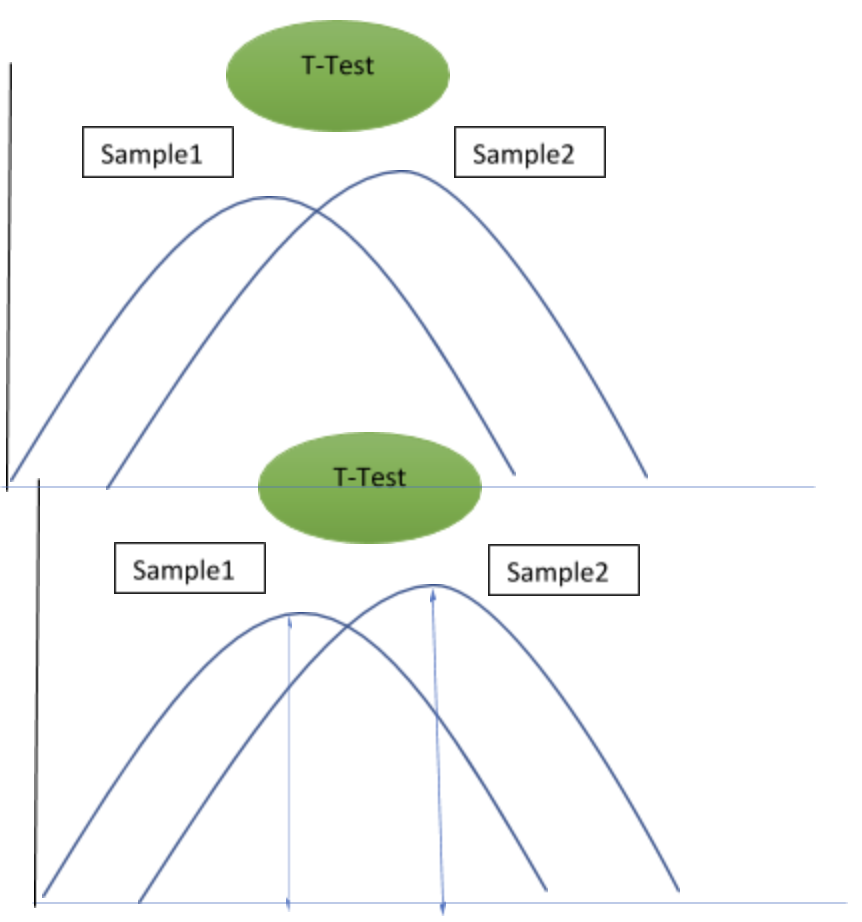
Here is an illustration of how T-Test works on a sample

Mean (Sample1) – Mean (Sample2) divided by the SQRT ( SQR(Standard Deviation (Sample1)) / Total Sample Size + SQR (Standard Deviation(Sample2)) / Total Sample Size )
Null Hypothesis (H0), Define with a negative assumption that there is no significant difference between the samples we have selected.
Select a Critical value and compare it with the T Value.
T value < Critical value, don’t reject the Null Hypothesis.
T Value > Critical value, reject the Null Hypothesis and accept the alternate hypothesis
The critical value is found using the T Table. The probability we use in within 6 Sigma standards, either 0.05 or 0.025 or 0.01, this gives us a significance, commonly used one is 0.05, that compliments to the fact that if we use the sampling hundred times, 95% of times we reject Null hypothesis and only 5% of times is where we accept the hypothesis. Degrees of freedom are used to pick up the sum of the sample size of both samples -2, N1+N2-2.
This article is presented by AIM Expert Network (AEN), an invite-only thought leadership platform for tech experts. Check your eligibility.