 Businesses throughout the world are relying more and more on analytics to fine tune their operations. The application of data analysis techniques has been prevalent in large corporate companies for several decades to monitor sales, target audience for maximising marketing potential, work processes to reduce on internal cost as well as a variety of other aspects of the business where large quantity and regular flow of data is available. However, in the last decade a there has been a growing trend for smaller businesses to apply some of these techniques to bolster their competitiveness. The most prevalent usage has been in off-the-shelf services to monitor internet usage and interaction with a business website in order to leverage Search Engine Optimisation (SEO) techniques and therefore drive more traffic to online operations. However, the use of a wider spectrum of Business Intelligence (BI hereafter) techniques has remained primarily within the reach of large companies due to the cost involved.
In this article I wish to address the opportunities BI offers to Small and Medium size Enterprises (SME) in their quest to improve their overall business-awareness and by doing so open new avenues to bolster their competitiveness. The primary goal of any BI exercise in a company is to inform the management of the health of the its business, at times forewarn of impending problems/opportunities and at best throw light on the what to expect in the medium-term future. However, the cost of BI is high. There is no single recipe for good BI that can be procured over-the-counter and tweaked for your business. It requires planning, data collection channels, technical and analytical skills, and most important a creative approach to adapt it to one’s needs. BI analyst are nurtured rather than created, and therefore command a sizeable salary. So what can a SME with a limited budget and time for BI do in order to procure itself a tailored made BI dashboard?
Below I highlight 5 indicators that I recommend for retail and manufacturing sector SME. These indicators require an initial investment of time and money to set up and calibrate for the specific needs of the business. This requires sourcing the relevant data from the company computers (often in the form of excel sheets and Tally type accounting systems); preparing that data to automate the analytical algorithms; fine tuning the analysis and presentation to meet the requirements of the management; and formatting the result into a presentable monthly decision ready dashboard. Once this initial investment is complete, the maintenance of the dashboard consist of data collection into a defined template to be plugged into the analysis, a very low cost requirement and few-days a month effort. The initial cost can be made as a one-time investment with a BI consulting firm that understands the limitations of SME office administration. The indicators listed below are easily created on an excel sheet.
For an introduction to BI, I invite the readers to visit the following page that discusses the basic concepts and categories of questions answered by such analysis.
Deseasonalized Sales
This is a very useful analysis to get the bigger picture of where your sales are heading. In India many retail and manufacturing SMEs see their best sales occur in the first quarter, often associated with the financial year-end when bonuses and pay rises come into effect. The other big sale period happening in October for the Diwali festival would also show a strong correlation with a sales trend. A plot of sales performance would show a peak at these two periods. Fig 1 & 2 shows a plot of sales of mobile phones from a several retail outlets as a dotted line, clearly illustrating this trend.
If a business has sales records spanning several decades, then it can also apply this technique on different spans of several years in order to study the change in seasonal sales. For example, since 1991 (the first wave of economic liberalization) the market economics are shifted, empowering a growing middle class of consumers. The pre-1991 seasonal sales trend must have evolved to what it is today, and many SME businesses have seen rapid changes in their sales trend.
For a detailed explanation of deseaonalised sales analysis technique you can visit the following site which gives a good explanation using excel as the BI tool. This technique is also has the potential for simple predictive analysis of future sales.
Plotting Cost vs Revenue to identify cost lag loops
This analysis is rather simple, but is a powerful indicator of cost control when a business is heading towards a downturn, allowing the business owner to better prepare for a drop in revenue. The analysis entails knowledge of financial practices and cost categories of business. The basic idea is that when a business experiences growth, mostly correlated with a booming economy, then there are pressures to expand resources in order to best take advantage of opportunities. This means an increase in cost expenditure for the business in order to meet the demand, shorten supply times, increase market share and so on. It also means (hopefully) an increase in revenue. However, growth periods don’t last and there comes a time when the economy slows down and possibly slumps, revenues drop or even plummet in extreme scenarios, but cost do not always drop as quickly as one would like. This is known as the cost lag loop: revenues drop faster than cost. As a result a business can quickly find itself in a loss making situation where cost outweighs revenue. Having an indicator that shows the management what is the position of the company becomes very important in such situations. This is where a good understanding of types of cost is important.
There are several types of cost, and one can review them on this page. However, to summarise a complex scenario, there are two basic type of cost in a business, controllable cost and non-controllable cost. Controllable costs are those that can easily be reduced when a downturn is looming. Non-controllable are more difficult to reduce quickly. Hence, when planning a growth strategy it is very important to keep in mind the amount of non-controllable cost one is expanding. The rule of thumb is rent instead of lease (a rent contract is much easier to terminate than a lease), lease instead of buy (again, if leasing, insert an exit clause to be able to shed unnecessary cost quickly) and buy in order to sell quickly. Remember, in times of a downturn there are few buyers on the market.
Private Rate of Inflation
This indicator is possibly more apt for manufacturing sector businesses. It requires a little more effort initially to gather sources of data published by national bureau of statistics and finding ways to auto update that info, but once the mechanism is in place it should be relatively simple to set up an indicator that shows the inflation rate graph for materials on which an SME is dependent for its production. In an expanding economy such as India we keep hearing reports of inflation pressures and increase in cost of living. Inflation is a natural process of imbalances in demand and supply due to a growing economy. At different periods of the year as well as the era of economic expansion, inflation affects different commodities. Some of these are basic, bottom-of-the-pyramid items that have a repercussion on the entire market, such as the price of energy and fuel. We have seen several such effects as the government deregulation of fuel prices which has had an indirect effect on the cost of many staple food products as the cost of transport shot up.
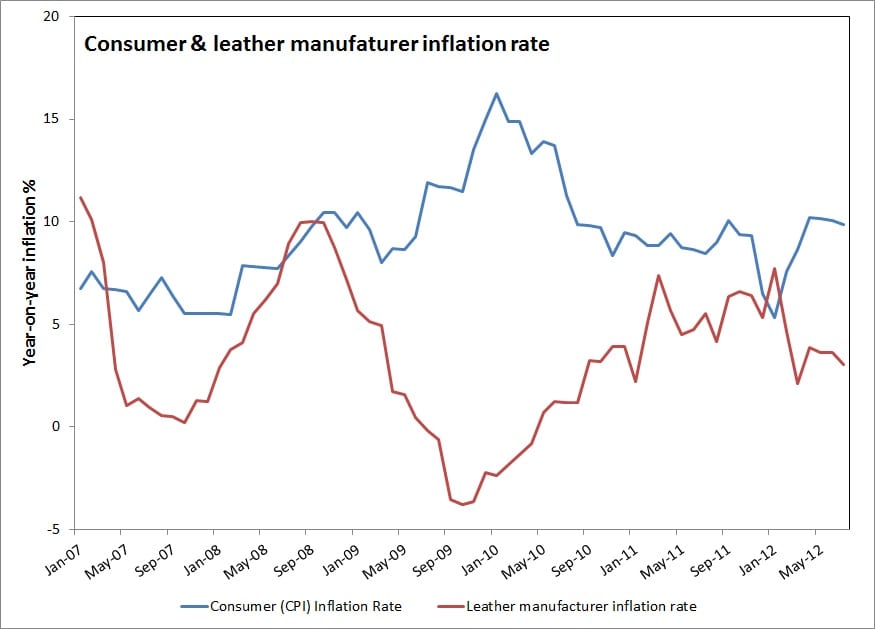
Inflation figures reported in the news is an average figure of a basket of products that defines the typical consumer. When a figure of 10% is quoted, it can be assumed that life is 10% dearer for the majority of consumers. However, this is not true for many businesses. A manufacturing business is only concerned with the commodities (raw materials/services) that directly impact its manufacturing process. This is where a private rate of inflation indicator is useful, it shows the general trend in cost increase that the management can expect in the short-to-medium term. This is useful for planning production.
Figure 5 shows the inflation in consumer price index for the country since 2007 as well as that of a leather goods manufacturer. The private inflation rate plotted is a weighted average of price indices for raw materials involved in the production of leather products. It includes energy, leather raw materials, machinery and transport cost.
Buying patterns indicator
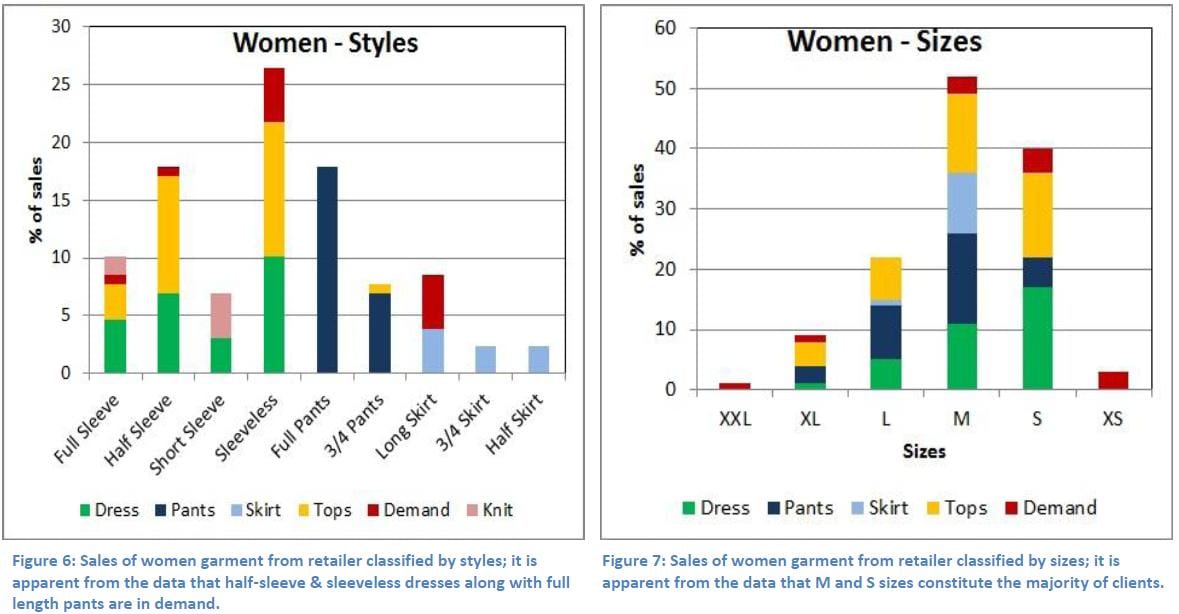
This analysis is again more apt for retailer businesses. A retail outlet usually sells a range of products with a large spectrum of prices. For example, a garment outlet will sell small accessories for a few 100 Rs to more intricate designs that may touch several 1000 Rs. An analysis of the client buying trend can be quite revealing when the management wants to look at new products or possibly open a new shop in a different neighbourhood. A sales analysis looks that the products that are most popular and therefore should be well stocked. It also identifies what is the purchasing power of the average client. For a given location, a retail outlet will cater to a specific customer base with an average purchasing ability. The analysis reveals what is the cut off value beyond which most potential customers would not spend for it would be exceed their budget. This kind of analysis is useful because it gives a clear idea of what kind of products to stock in that outlet. Products that are priced beyond that cut off value would simply be too expensive for the majority of the client base.
Over a longer period of time this indicator would evolve in parallel to the affluence of the clientele. This data could further be correlated to a market study of the demography of the neighbourhood. Such a correlation would become extremely useful when planning an expansion of the business with a new retail outlet in a different neighbourhood. Market data for the new location could then be used to predict the buying trend of the customers likely to visit that outlet and therefore better plan the initial stock of product to be displayed in that outlet.
Productivity cost
In many businesses it is difficult to estimate the cost of non-core services and activities. A manufacturing business calculates cost of manufacturing goods as a basis of total cost of the business versus total productive capacity and selling potential. A retailer sells at MRP and tries to control cost as per sales revenues. However, many businesses often have non-core services that they also offer to their clients. A manufacturer may repair damaged goods, or offer maintenance services. Similarly, a retailer may offer delivery services or provide information and guidance to its clients. Pricing these extra services is often difficult. To solve this issue, one can calculate the cost of productive man-power. Productive employees of a business are those whose time can be directly billed as part of the services/products the business is selling to its clients. For example, a manager is not directly billable as he/she renders no service to the clients, but rather to the business itself. To compute the productive cost is rather straightforward, it is the total sum of cost of the business divided by the total working time of productive staff. In simple numbers, say a business expands Rs 10 lakh as its cost of production per year, and has 1 productive staff. The productive time is 365 days in a year, less vacation days for that 1 staff, less non-working days (public holidays, Sundays.), which for simplicity we shall say adds up to 250 working days a year. This means that the business has a productive cost of 4000 Rs per day. If this 1 productive staff is required to work for half-a-day on special service, the company should charge at least 2000 Rs for it.
A productivity cost analysis is especially useful when broken down into the various factors that make up the cost. An analysis on business cost breakdown as well as ratio of productive staff gives management a good understanding as to how to maintain the company’s competitiveness.
Conclusion
I have outlined 5 indicators that can easily be implemented with minimal investment by an SME business. There are of course a number of other indicators that can be quite useful depending on the particular business. However, I believe that the power of BI can be leveraged by the smallest of business with careful and creative thinking using the most basic tool available off-the-shelf today, may it be an excel sheet or even the online Google Docs services. A word of caution nonetheless, BI is not a magical wand to replace mature and seasoned business acumen, it is only a tool to expand one’s awareness of the complex evolution of the business world of today.


