Every machine learning project begins by understanding what the data and drawing the objectives. While applying machine learning algorithms to your data set, you are understanding, building and analyzing the data as to get the end result.
Following are the steps involved in creating a well-defined ML project:
- Understand and define the problem
- Analyse and prepare the data
- Apply the algorithms
- Reduce the errors
- Predict the result
To understand various machine learning algorithms let us use the Iris data set, one of the most famous datasets available.
Problem Statement
This data set consists of the physical parameters of three species of flower — Versicolor, Setosa and Virginica. The numeric parameters which the dataset contains are Sepal width, Sepal length, Petal width and Petal length. In this data we will be predicting the classes of the flowers based on these parameters.The data consists of continuous numeric values which describe the dimensions of the respective features. We will be training the model based on these features.
Let us dive into building of our ML project. We will be using Python to understand and train our model. Numpy, Pandas and SciKit Learn are some of the inbuilt libraries in Python.
Iris dataset is already available in SciKit Learn library and we can directly import it with the following code:
The parameters of the iris flowers can be expressed in the form of a dataframe shown in the image below, and the column ‘class’ tells us which category it belongs to.
As mentioned above, there are three types of flowers in our dataset. Let us look at the target names of each of the flower.
Understanding the data
This is relatively a very small data set with 150 samples. Since the dataframe has four features (Sepal length, sepal width, petal length and petal width) with 150 samples belonging to either of the three target classes, our matrix will be:
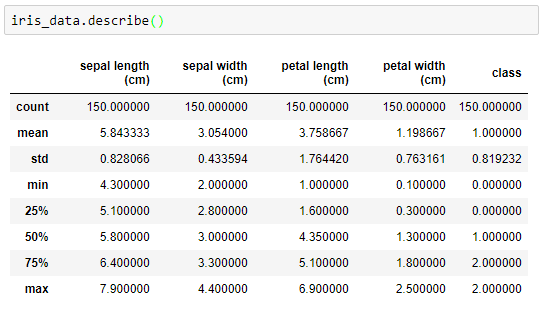
 Now going into the mathematics of the dataset, let us find out the standard deviation, mean, minimum value and the four quartile percentile of the data.
Since it is a pre defined data set every class has equal number of samples. That is 50 per class.
Analysing the data visually
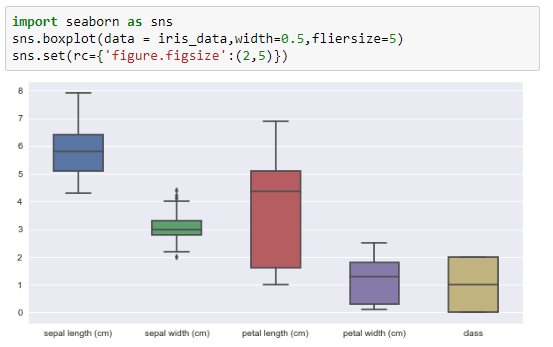
Let us look at the box plot of the dataset, which shows us the visual representation of how our data is scattered over the the plane. Box plot is a percentile-based graph, which divides the data into four quartiles of 25% each. This method is used in statistical analysis to understand various measures such as mean, median and deviation.
To understand how each feature accounts for classification of the data, we can build a scatter plot which shows us the correlation with respect to other features. This method helps just to figure out the important features which account the most for the classification in our model.
Applying the algorithm
1. Dividing the data for training and testing
Once we have understood what the dataset is about, we can start training a model based on the algorithms. Here, we will be implementing some of the commonly used algorithms in machine learning. Let us start by training our model with some of the samples. We will be using an inbuilt library called ‘train_test_split’ which divides our data set into a ratio of 70:30. It can be done by the following code:
2. Training the model
Using some of the commonly used algorithms, we will be training our model to check how accurate every algorithm is. We will be implementing these algorithms to compare:
- K – Nearest Neighbour (KNN)
- Support Vector Machine (SVM)
- Randomforest
- Logistic Regression
Let us start building our model and predicting accuracy of every algorithm used. We can also check which gives the best result.
We can start with the first algorithm KNN with number of neighbours, 5. We can build our model like below:
Next, the Support Vector Machine model works on the principle of Radial Basis function with default parameters. We will be using the RBF kernel to check the accuracy.
Randomforest is one of the highly accurate nonlinear algorithm, which works on the principle of Decision Tree Classification. Let us see how accurate it is:
Logistic regression works on two schemes, first, if it is a binary classification problem, it works as one vs the rest, and if it is a multi class classification problem it works as one vs many.
3. Choose a model and Tune the parameters
From the above models, we saw that randomforest gives us the best accuracy of 97.59%. Let us tune the parameter to get a 100% accuracy. Let us set the number of trees to be 1,000 to check if our model is performing well.
Conclusion
In ML, there is no specific model or an algorithm which can give 100% result to every single dataset. We need to understand the data before we apply any algorithm and build our model depending on the desired result. This dataset gives us 100% accuracy, which is nearly impossible. From the above models, RandomForest gives optimal accuracy compared to other algorithms because it works best with continuous data and it also applies a nonlinear relationship to the features. By using a this algorithm, you reduce the chances of overfitting and the variance in the data which thus leads to better accuracy.


