

Machine Learning has found its application across a number of domains that involve mimicking the complexities and senses of human beings. Computer Vision and Speech synthesis have been around since the late 1960s and have exponentially improved over time — especially in the last few years.
Today, we will focus on Speech Synthesis which is one of the growing research areas with a number of real-world applications.
Speech synthesis as a technology has already entered the common households as a powerhouse for many voice-operated devices including virtual assistants like Alexa, Google Assistant, Cortana and Siri.
Voice assistants today are more than just audio encyclopedias — they can also bark, meow and whine like cute animals. But how does this technology work? As complicated as it seems, speech synthesis is backed by many complex algorithms that do more than just synthesis, but analyse the sound and produces insights. One good application is the sound classification. Machines today are capable of classifying different sounds.
Visualising Sounds
“Sound is a vibration that propagates as an audible wave of pressure, through a transmission medium such as a gas, liquid or solid”
This textbook explanation of sound is self-explanatory, as to how humans and most inhabitants of earth perceive sound. But how does a machine do it? Machines are good pretty with vision, so we convert sounds into numbers and images. This is what we will do in this hands-on session.
The exponential advancement in ML and the number of researches being done in the field has given rise to many tools and software kits that make it effortless to implement complex tasks in just a few lines of codes.
In one of our previous articles, we learned how to convert a simple text classifier into a fully functional speech classifier just by adding a few lines of code. In this tutorial, we will discuss some of the various aspects to determine the characteristics of a sound and we will learn to visualize any sound as a beautiful wave.
You will learn to effortlessly load audio files and play it in Python notebooks and also to convert audio files into spectrograms in just 5 lines of code. And for fun, we will also compare the spectrograph of different songs.
Ready Set Code
We will use the IPython module to load the audio file and a popular library called Librosa to visualize it.
The following example has been done on Google Colab and given below are the environment details:
- Python 3.6.9
- Librosa 0.6.3
Installing Librosa
LibROSA is a python package that helps us analyse audio files and provides the building blocks necessary to create audio information retrieval systems. We will install the librosa library using the following command:
!pip install librosa
Assuming that your Google drive has some audio files in it, we will proceed to load the file. But before that let’s mount the google drive on Colab.
Mounting Google Drive
Execute and authenticate using the following code block to access your Google Drive on colab.
from google.colab import drive
drive.mount('/GD')
Importing The Libraries
import IPython.display as ipd
import librosa
import librosa.display
import matplotlib.pyplot as plt
Loading And Playing Audio Files In Jupyter
We will now load our audio file in just a one liner. Type and execute the following code.
ipd.Audio('/GD/.../audio/numb.m4a')
On executing the above code you will get an inline audio player which can be used to play the audio as shown below.

Spectrograms
We can now use the librosa library to plot the spectrogram for an audio file in just 4 lines of code.
First, we will initialize the plot with a figure size.
plt.figure(figsize=(15,4))
We will then load the audio file using librosa and will collect the data array and sampling rate for the audio file.
filename = '/GD/My Drive/.../audio/numb.m4a'
data,sample_rate1 = librosa.load(filename, sr=22050, mono=True, offset=0.0, duration=50, res_type='kaiser_best')
Sampling

Sound is a continuous wave. We can digitise sound by breaking the continuous wave into discrete signals. This process is called sampling. Sampling converts a sound wave into a sequence of samples or a discrete-time signal.
The load functions loads the audio file and converts it into an array of values which represent the amplitude if a sample at a given point of time.
Sampling Rate
The sampling rate is the number of samples per second. Hz or Hertz is the unit of the sampling rate. 20 kHz is the audible range for human beings.
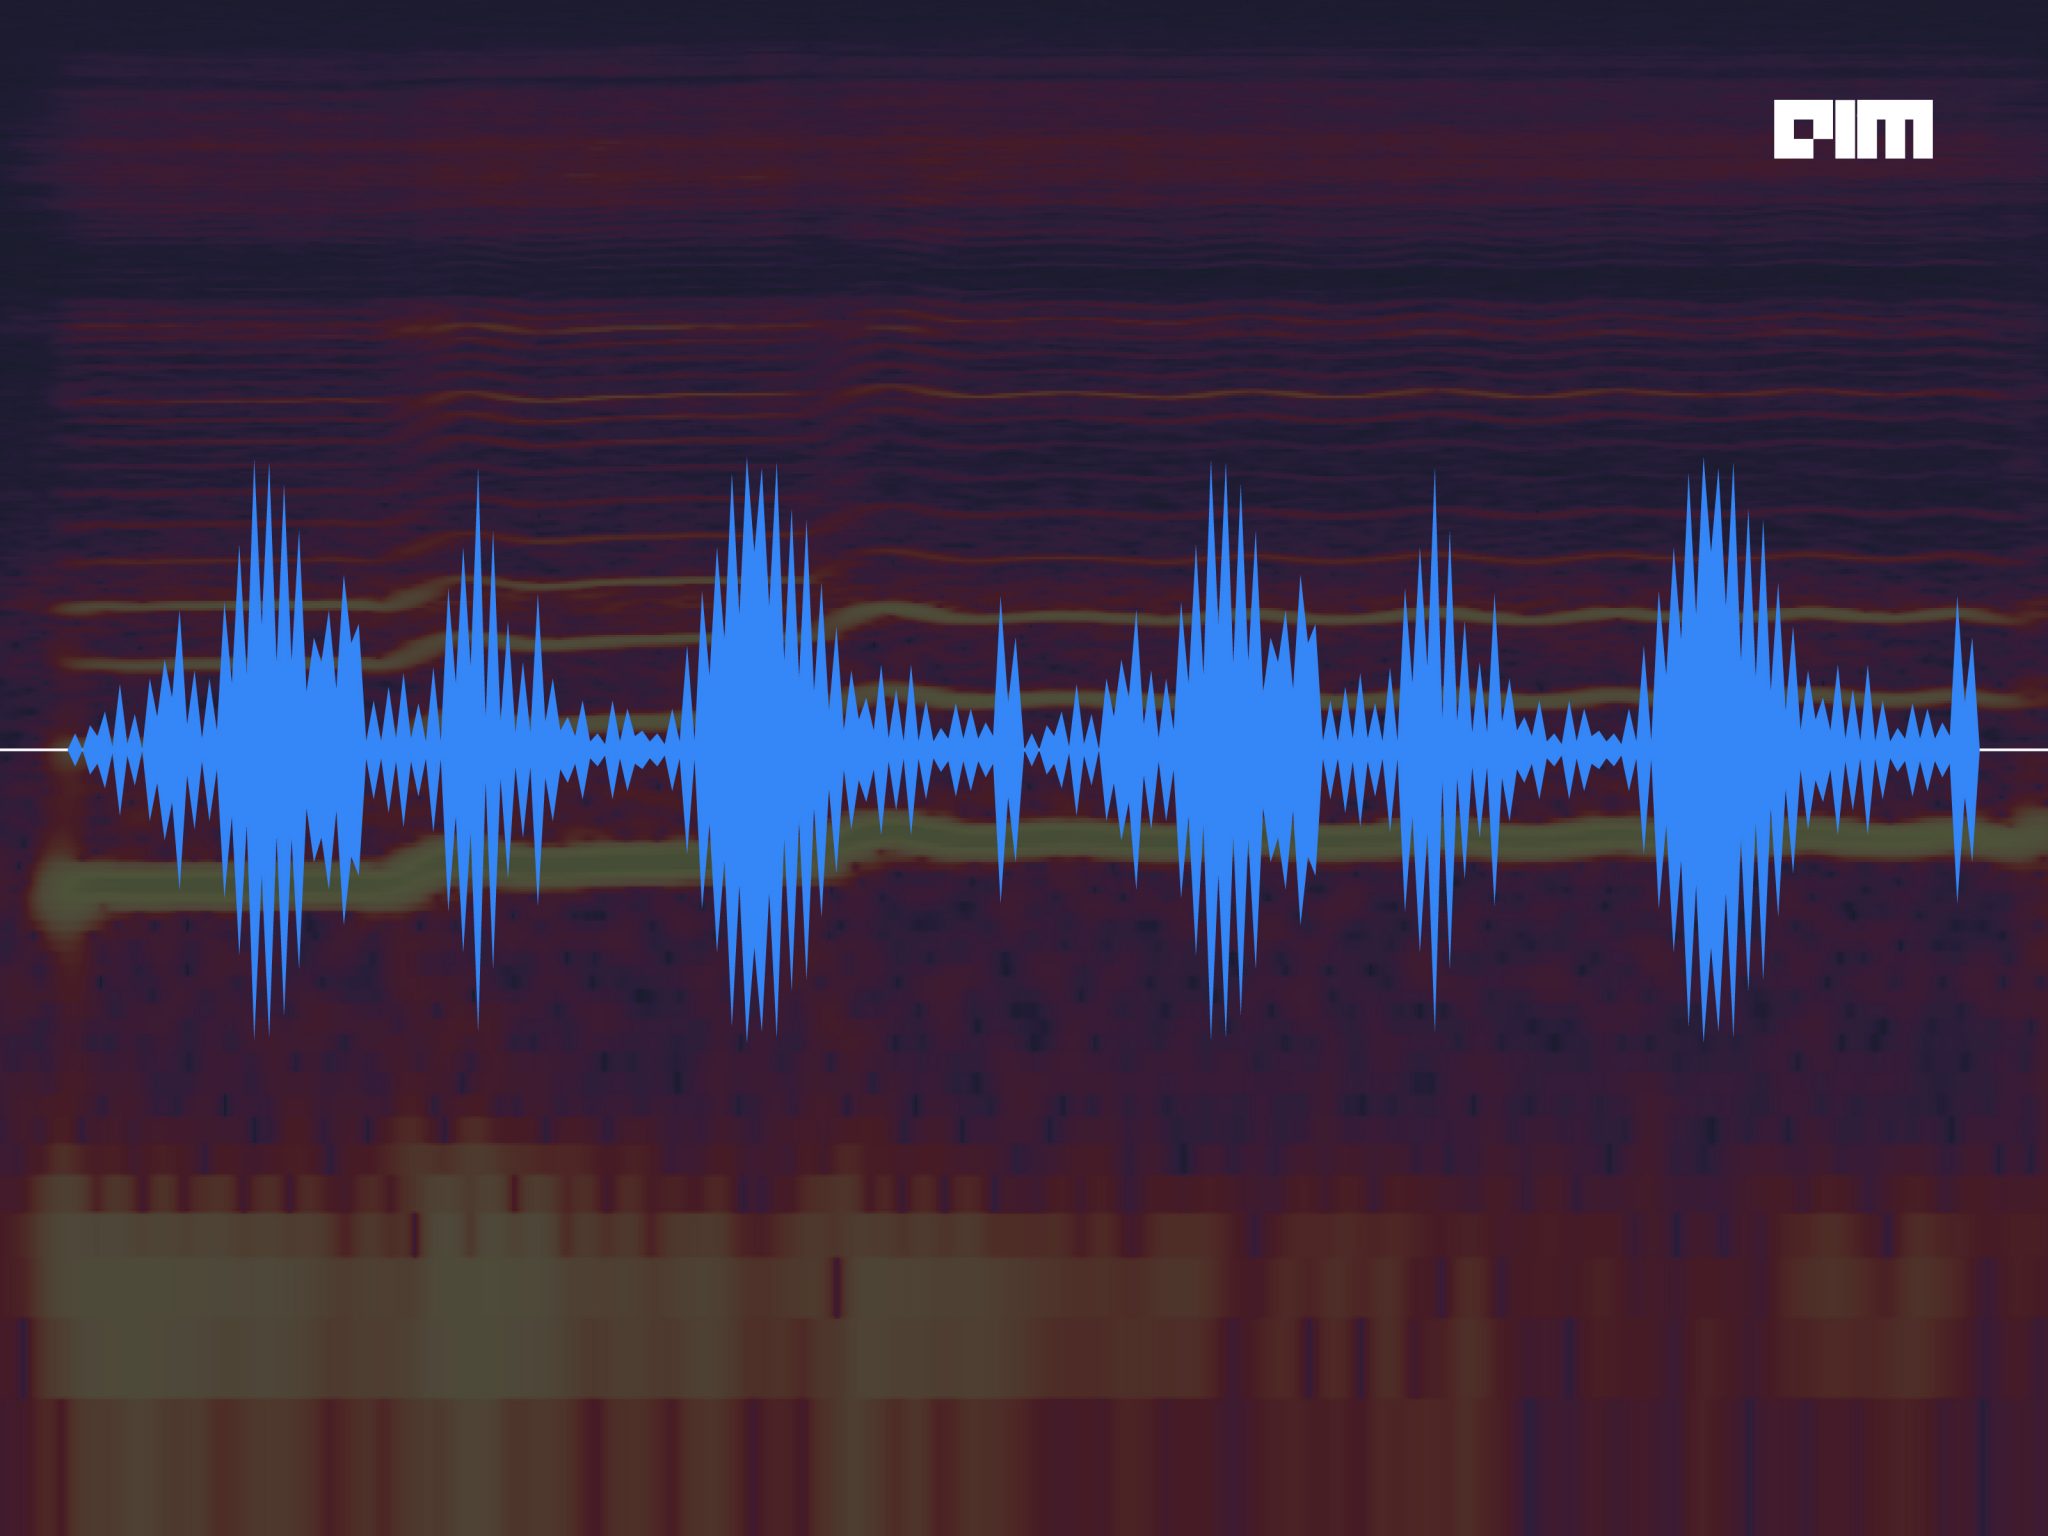
We can now plot the spectrogram using the waveplot method as shown below:
librosa.display.waveplot(data,sr=sample_rate1, max_points=50000.0, x_axis='time', offset=0.0, max_sr=1000)

Fun Time: Linkin Park Vs Micheal Jackson Vs Blue
Lets compare the Spectrograms for three very popular songs:


Complete Code
What’s Ahead
Keeping in mind the Machine Learning context, the above example has great importance. This is especially true when we are dealing with sound data in creating intelligent machines such as recommendation engines or machine that can classify music into genres or security systems such as voice recognition systems.