


|
Listen to this story
|
When it comes to the stock market, a significant population still relies on recommendations and tips from friend circles, newspapers, TV channels and more. While this trend has witnessed significant decline since Zerodha put a hard stopper to brokers’ businesses, there is still scope for improvement in the sector.
StockEdge is one such company working to educate people on analytics-based investing. The platform uses algorithms to process, scan and identify the relevant stocks for retail investors. It also offers ready-made scanners that allow retail investors or swing traders to quickly identify the most relevant stocks in accordance with their trading or investing philosophy.
While some of these screeners are derived from statistical studies, others use pattern recognition techniques to identify the trend. To know more about the platform, Analytics India Magazine reached out to Vinay Pagaria, co-founder and CTO at StockEdge.
“We wanted to create an engine or a software tool, which people could use, not just for educating themselves, but also for doing deep analytics on stock market data so that they can take sensible, good decisions,” said Pagaria while explaining the intention behind the launch of ‘StockEdge’.
How StockEdge uses AI/ML
Explaining how StockEdge has used AI so far, Pagaria said that AI/ML is used primarily for two purposes. “One is on the side of data analytics, specifically for the stock market, so people can decide which stocks to buy, and the other is on the user behaviour because we are a B2C application having four million downloads.”
Giving an example of what they have done with AI, Pagaria explained how they have an algorithm to figure out the investments made by famous investors. He said, “The portfolio of famous investors in India is not really public. However, each company has to follow a regulation under which it has to state the names of those who hold a significant amount in their company.”
For example, if Rakesh Jhunjunwala holds 2% shares in some company, the company has to report likewise. What StockEdge did was collect all this information and club them together. You can say this is just mathematical aggregation. Where is the AI in this?
So, the challenge is that when these reports come, they don’t come with the Aadhaar number or the Pan number of the investor. It comes merely with the name; companies can put that name in any order. Someone writes Rakesh Jhunjhunwala, someone writes Mr Jhunjhunwala Rakesh while others can make spelling mistakes. So, StockEdge built an algorithm which could auto-detect what names belong to the same family of investors.
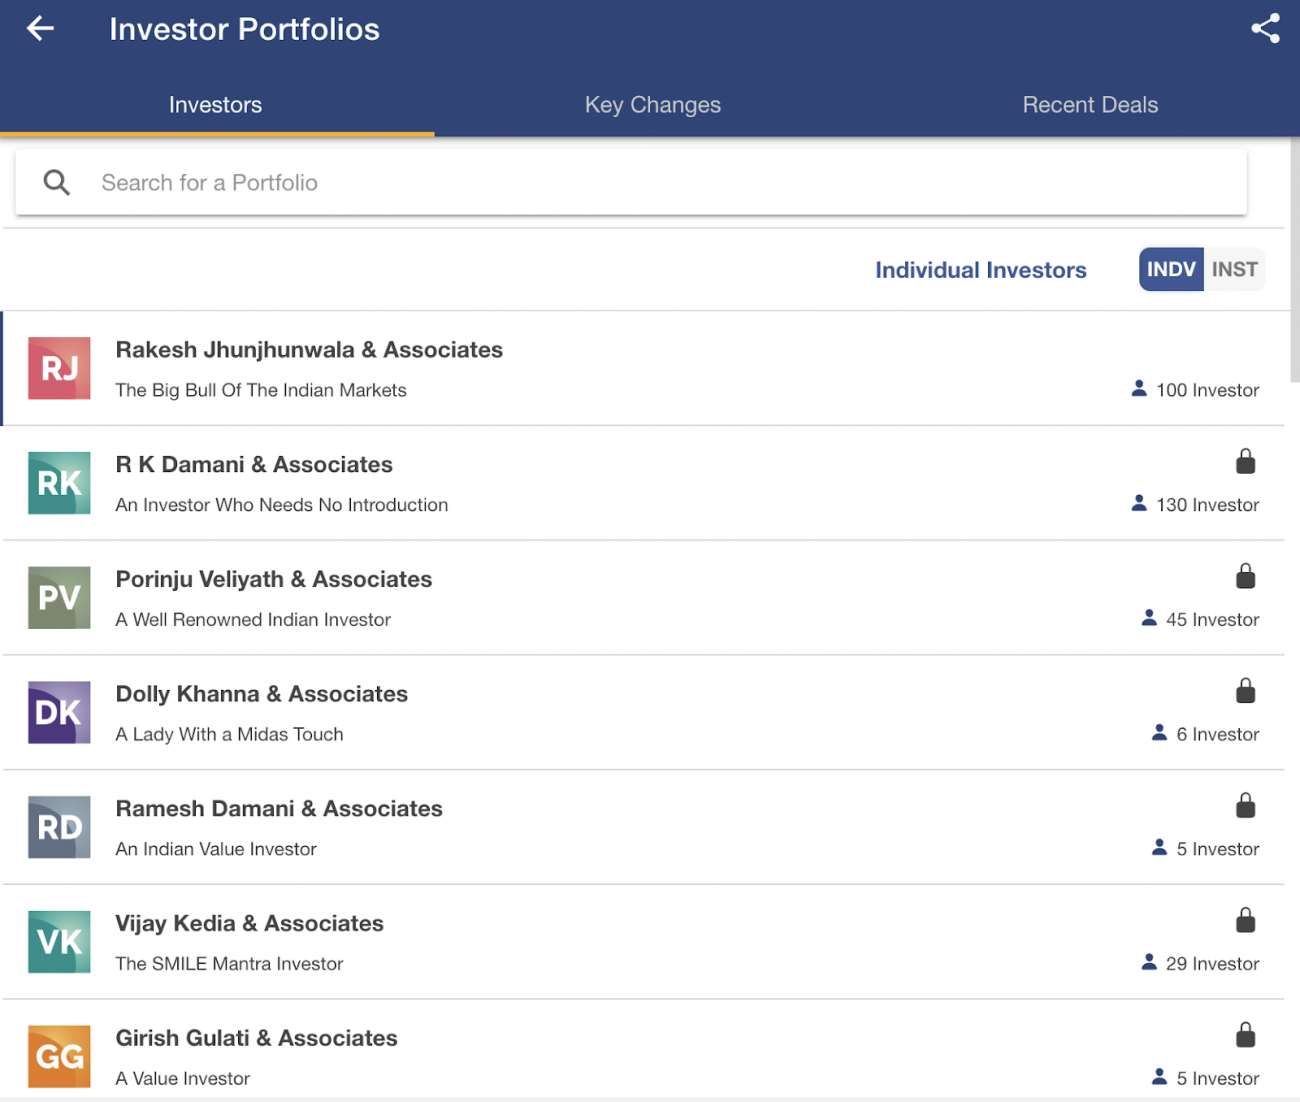
What the company has done is every day, users can track what these investors are doing. Are they making any large deals in any company? What is their shareholding? Is this year’s holding of that particular investor in a particular company increasing or decreasing?
If one can see all of this at a consolidated level, it also helps them understand what these long-term investors are putting in what type of sectors. Later, StockEdge also added more than 200 large institutions, including FIIs (foreign institutional investors), to track what they are doing.
For example, if the government of Singapore is holding stocks, how much stake does it have in large companies in India? And when is it increasing and decreasing? This is not direct information but is the collective output of what they have done so far.
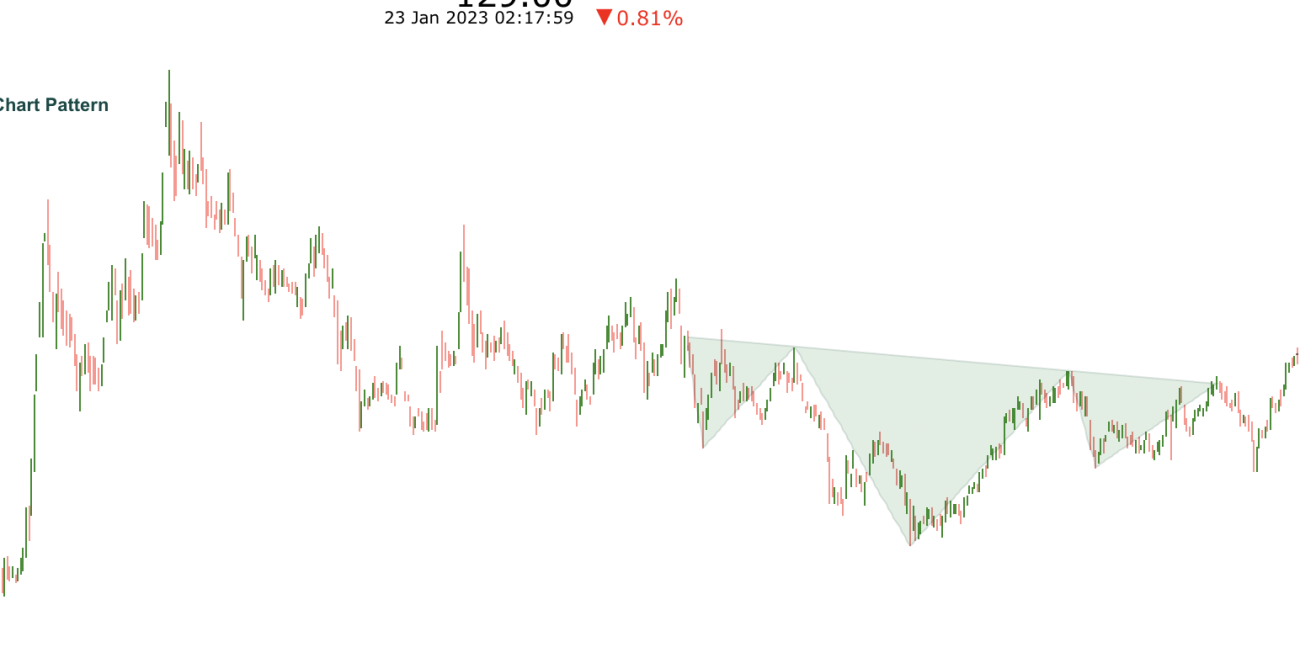
Chart Pattern Recognition
Addressing various chart pattern recognition algorithms, Pagaria said that they were probably the first in India to launch what is known as candlestick pattern recognition. “Due to this feature,” explained Pagaria, “merely by basically looking at a particular candle, I can find out the sentiment of that stock in the market”.

Highlighting other features, Pagaria said that there’s a pattern called triangle pattern. What a triangle pattern implies is that the highs at different points have been at a flat level but the lows are slowly increasing.

“This means that there is a fixed resistance on the top but the support line is moving up. Now, whenever this pattern is broken and the stock goes out of it, it is a very, very positive sign. And it may indicate a sudden, you know, surge in the prices of this talk,” elaborated Pagaria. The difficult part here is the shapes may not be formed in two days, three days, or seven days. These may take weeks or months to form.
“What we have done is path breaking,” claims Pagaria. StockEdge asserts that they have run algorithms which can now detect patterns based on the shapes of the charts automatically. On a daily basis, it is believed to be able to publish a consolidated list of all patterns that have been detected across stocks.
The platform can show users a list of all the stocks where that pattern has happened. Additionally, it can also show all the past instances whenever the particular pattern had happened. So, the users can validate for themselves whenever that pattern emerged previously.
Sharing about how they use data visualisation, Pagaria said that it is the crux of the entire work that they are undertaking. “We are dealing with a huge amount of data. If you look at the market side, there are more than 7,000 stocks with so many years of data for every stock. Different types of data points are not just price, it’s financial data, fundamental data, statistical data, and more,” said Pagaria.
Vinay Pagaria also claims that his goal throughout has been to convey insights by showing the least amount of data to the end user.
“We have innovated and added a lot of unique visualisations, which have not been there before. Many of them are self-created visualisations, which we have encoded. Of course, we use some framework but it’s not a direct data visualisation tool. More like a data visualisation development tool that we have used.”


