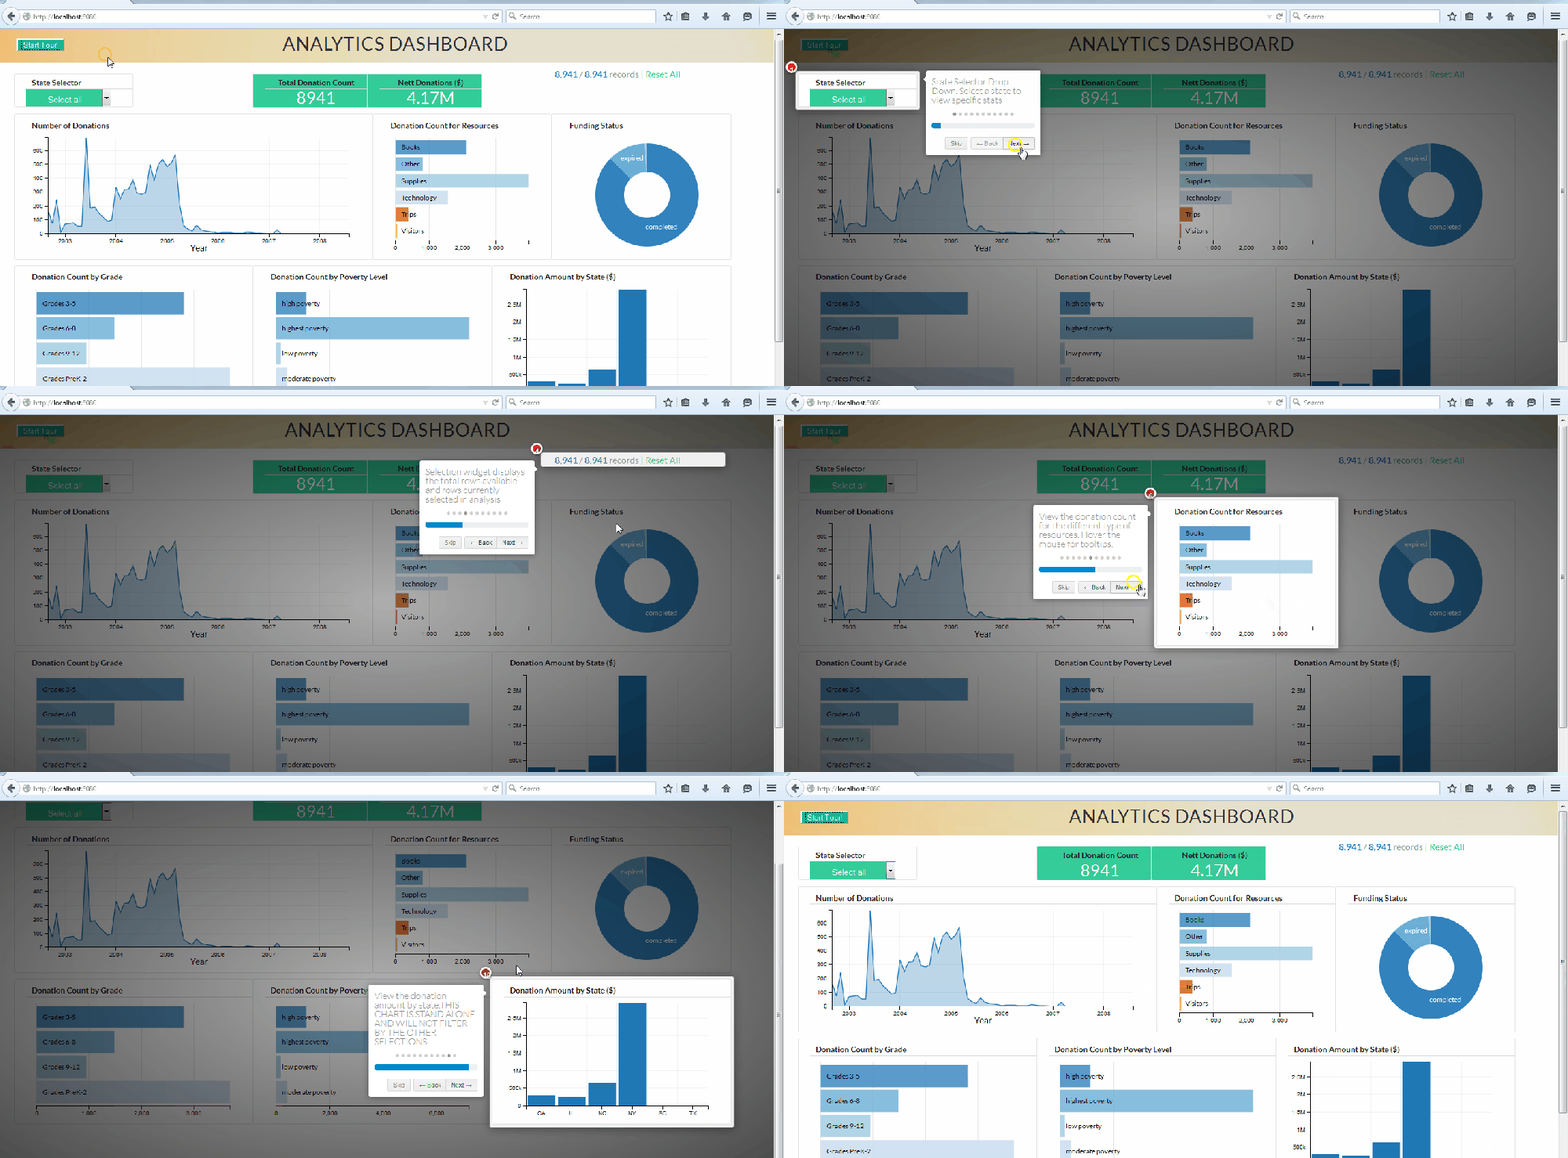
Today we will see how to add a guided step by step story-line to our D3 dashboard. We will be using another awesome open source java script library: Intro.js
I have been doing dash-boarding and visualization for quite some time now. Recently i made a D3 dashboard demo for internal consumption at the place i work. The tough part was going through the motions, explaining the whole dashboard and visuals to all the stakeholders one by one. Sure i could have made a video but then the dashboard would lose something. Visual story telling is as necessary as the visualizations that you are building. The visuals need to make business sense and answer questions. We viz folks try to build a story line around our dashboards as much as possible. Explaining them however gets time consuming and repetitive. Here’s when Intro.js comes for the save.
I am quoting the Intro.js site here:
Better introductions for websites and features with a step-by-step guide for your projects.
Using Intro.js we can attach pop-up tool tips to our html graphs (div’s) and further more we can assign an order of appearance as well as style them to make it look snappier. So, essentially we can assign an interactive tool tip to our graphs and display helpful information to the user who is going to use the dashboard. Trust me, it’s a very nifty and nice feature to have. You don’t have to write a lot of documentation to make someone hit the road running on your dashboard.
I strongly recommend going through the tutorial that guides you on creating an interactive dashboard before starting this tutorial. We will be adding features to that dashboard itself.
Now to the implementation!
The steps to success:
- Get your hands on the working dashboard
- Insert the Intro.js libraries into your code
- Attach tool tip code to your div’s
- Check the results
- Here’s how our finished dashboard will look like:
I have made online a working model of this project. It can be accessed at anmolkoul.github.io for the next some time.
The source code for this tutorial can be found at this github repository. This code is complete in itself and utilizes the dashboard we built previously with D3.js, MongoDB, Node js and implements the Intro.js library into it.
data-step:”1″ data-intro=”A row chart displays the segment categories for customers!”style=”font-weight: normal” data-position=”right”
The properties highlighted in red are the ones we can change and need to change. Once we have a story line in mind we can assign the above code in that order to div’s. Here data-step is the order in which the tool-tip for the div will get generated. So the first visual you want to display information for should have a data-step value of 1. data-intro contains the description that you want to display for that particular div. You can add html stuff like breaks and all inside the data-intro text as well. You can make the tool-tip font bolder by modifying the weight property. Finally you can select the placement of the generated tool tip by using the data-position property
Intro.js works really fine even if you have a long single page. It automatically focuses from one div to another seamlessly.
That’s it folks. We have successfully built a dashboard with guided analysis using Intro.js. Use it to enhance your visualization experience and keep experimenting.
The detailed post can be viewed at https://anmolkoul.wordpress.com/2015/07/24/story-boarding-in-a-d3-js-dashboard-using-intro-js/


