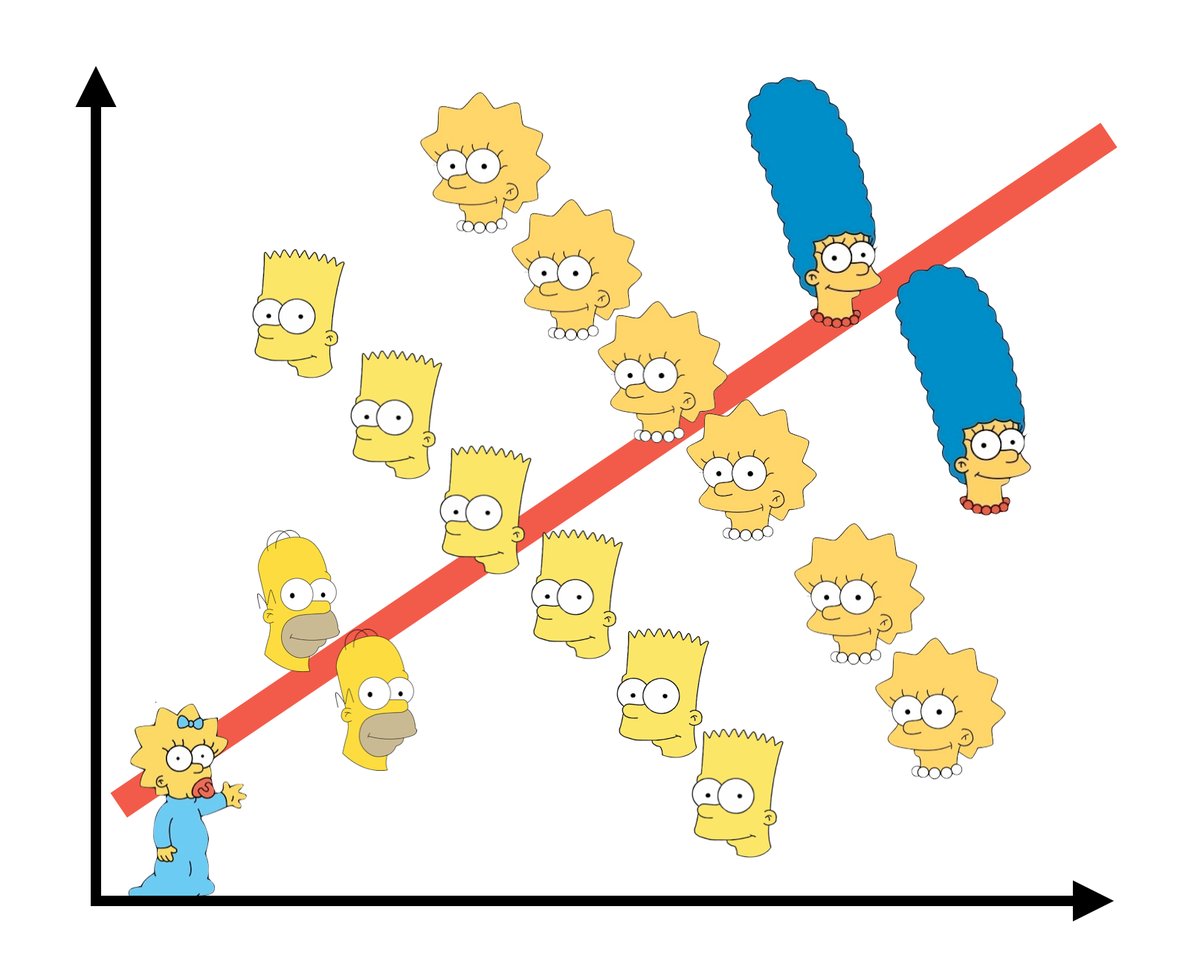
The Simpson’s paradox arises in many real-world contexts. It is mathematically very trivial but involves deep statistical meaning. In fact, there is a whole website dedicated to Simpson paradox. Simpson Paradox or the Yule-Simpson effect was first described by Edward Simpson in a technical paper in 1951 but Karl Pearson and Udny Yule had noticed this phenomenon much earlier.
The Mathematics behind Simpson’s Paradox
Simpson’s Paradox is in a sense an arithmetic trick. (Weighted averages can lead to reversals of meaningful relationships.)
(A1/C1) > (A2/C2) and (B1/D1) > (B2/D2).Then, (A1+B1)/(C1+D1) < (A2+B2)/(C2+D2)
Daily Life Examples
- Medicine
- Education
- Cricket
- Elections
- Medicine: Consider the following medical study dealing with Kidney Stone treatment (C. R. Charig, D. R. Webb, S. R. Payne, O. E. Wickham (March 1986)).The following two treatments were considered:
| Treatment A | Treatment B |
| 78% (273/350) | 83% (289/350) |
Table 1.
Any individual would obviously prefer Treatment B over Treatment A (as the success rate of Treatment B is higher than Treatment A). This is an observational study and not a clinical trial. But if we look more closely than,
| Treatment A | Treatment B | |
| Small Stone | 93% (81/87) | 87% (234/270) |
| Large Stone | 73% (192/263) | 69% (55/80) |
Table 2.
Now we find Treatment A to be better than Treatment B. So what exactly is happening? The size of the stone is the confounding variable (lurking variable or hidden variable). Treatment A is primarily applied to larger stones while treatment B is predominantly applied to smaller stones. But in most scenarios Treatment A appears to be better than Treatment B. In Table 1, we were like comparing apples with oranges, while in Table 2 we are comparing apples to apples. Thus, aggregate data might have a different meaning & it might mislead people (such as something given below)
Thus, aggregate answers & disaggregate answers are different.
- Education: There was a case in Graduate education in UC Berkley in 1973.In this case, University of California Berkley was worried about being sued for bias against women applying for Graduate school. The admission figures for 1973 showed that men applying were more likely than women to be admitted, and then the difference was so large that it was unlikely due to chance.
| Applicants | Admitted | |
| Men | 8442 | 44% |
| Women | 4321 | 35% |
Table 3
Table 3 clearly shows discrimination between men & women while applying & getting admissions at Graduate education at the University of California Berkley. But if we look deeper, then,
| Department | Men | Women | ||
| Applicants | Admitted | Applicants | Admitted | |
| A | 825 | 62% | 108 | 82% |
| B | 560 | 63% | 25 | 68% |
| C | 325 | 37% | 593 | 34% |
| D | 417 | 33% | 375 | 35% |
| E | 191 | 28% | 393 | 24% |
| F | 373 | 6% | 341 | 7% |
| Total | 2590 | 46% | 1835 | 30% |
Table 4
Table 4 presents a complete picture as compared to Table 3.Table 4 is the disaggregation department-wise while Table 3 is the overall applications & admissions at the University of California Berkley. Out of 110 departments, only 10 were significant at 0.05 level with 6 higher on women and 4 higher on men. Here, the confounding variable is the Department. Women tended to apply to competitive departments with low rates of admission, whereas men tended to apply to less-competitive departments with high rates of admission both among the qualified applicants. Hence, the University of California Berkley Departments were not carrying any discriminatory policy. The visual explanation is given on this website to help you understand better.
Thus, the disaggregated data does not have a story but when you aggregate the data you have a strong story of gender biasedness.
- Cricket: Consider the following overall batting averages of two batsmen.
| Innings | Runs | Average | |
| Batsman 1 | 40 | 1600 | 40 |
| Batsman 2 | 50 | 2100 | 42 |
Table 5
Batsman 2 seems to be better than Batsman 1 since Batsman 2 have a higher Batting average than Batsman 1 (Although Batsman 2 has played more innings than Batsman 1). Now if we disaggregate the data opposition wise this is what we get,
| Australia | Zimbabwe | |||||
| Innings | Runs | Average | Innings | Runs | Average | |
| Batsman 1 | 20 | 400 | 20 | 20 | 1200 | 60 |
| Batsman 2 | 10 | 100 | 10 | 40 | 2000 | 50 |
Table 6
Table 6 shows that Batsman 1 has a higher batting average than Batsman 2. The confounding variable is the Opposition type. Against both Australia & Zimbabwe, Batsman 1 seems to perform better than Batsman 2.But when we average over the entire innings Batsman 2 seems to be better than Batsman 1. Of course, Batsman 2 average will be relatively inflated because he has spent much more time playing against easier opposition. Thus, combined data reveals the flaws of averages. This throws an interesting question to IPL teams. Should IPL teams only go for batsman having higher averages or there is something more to it?
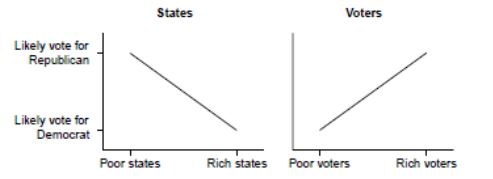
- Elections: Unfortunately I do not have any study or data to show the presence of Simpson’s paradox in Indian elections but an article by a leading newspaper hinted at the possibility of Simpson’s paradox in UP elections verdict of 2017. Andrew Gelman in his book “Red State, Blue State, Rich State, Poor State” describes the US election in the following way: Within any U.S. state, a wealthy voter is more likely to vote for a Republican than a poor voter; yet the wealthier states tend to favour Democratic candidates. Thus rich individuals (in any US state) tend to vote for Republicans, while states with a higher percentage of rich people tend to favour Democrats. The confounding variable here is the state of which the voter belongs. Thus, conditioning on whether the individual belongs to a rich state or a poor state gives a different result then aggregating voters (Rich and poor people) with Republican or Democrat. The following is the graph from his book:
Rich States vote for Democrats but Rich People vote for Republican
Why focus now on Simpson’s Paradox
Projects in Analytics often presents us with situations in which numbers tell us a completely different story as to what we think. Such situations are opportunities to learn something new by taking a deeper look at the data. Failure to perform sufficient nuanced analysis can lead to misunderstanding and bad decision making. Phenomena such as Simpson’s Paradox illustrate to us that without sufficient insight and domain knowledge, even simple statistical analyses can downright mislead and motivate misguided decisions.
In the age of Real-time data analytics, we are trying to detect pattern & take decisions in a very short period of time. The shorter the time period the more likely that short-term misdirection may emerge which may hide the true overall trend. That may lead to incorrect decisions & actions. As well being informed citizens in the age of data, if we are relying on heavily templated & packaged software and have no awareness about the drivers & limitations of the data, there is a low probability of spotting this bias.
Conclusion
Simpson’s paradox indicates the importance of understanding the data and its limitations. It reminds us significantly of critical thinking when dealing with data as well looking for hidden biases and variables present in the data as the world move towards data sets obtained in very short intervals of time (High-frequency data).
Simpson paradox may exist if we do not stratify the data deeply enough (There might be some hidden variables present). Too much aggregation becomes irrelevant and introduces biasedness although the variance becomes small. But if we disaggregate too much there will not be enough data or information to infer the underlying pattern because every individual is unique. This has increased the variance but reduced the biasedness. Thus, Simpson Paradox can be considered as an ultimate example of Bias and Variance Trade-off.
Simpson’s paradox can be avoided with the help of reviewing frequency tables and correlations along with a thorough understanding of the business problem being studied.
Big Take-Away: “Think Deeply”


