When you enter the Machine Learning dimension, it is highly likely that one of the first classifier algorithms you might come across is SVM, you will find that SVM is all over the place. SVM which stands for Support Vector Machine is one of the most popular classification algorithms used in Machine Learning.
In this article, we will learn about the intuition behind SVM classifier, how it classifies and also to implement an SVM classifier in python.
What is SVM?
Support Vector Machine or SVM is a supervised and linear Machine Learning algorithm most commonly used for solving classification problems and is also referred to as Support Vector Classification. There is also a subset of SVM called SVR which stands for Support Vector Regression which uses the same principles to solve regression problems. SVM also supports the kernel method also called the kernel SVM which allows us to tackle non-linearity.
How SVM works?
Just for the sake of understanding, we will leave the machines out of the picture for a minute. Now how would a human being like you and me classify a set of objects scattered on the surface of a table? Ofcourse we will consider all their physical and visual characteristics and then identify based on our prior knowledge. We can easily identify and distinguish apples and oranges based on their colour, texture, shape etc.
Now bringing back the machines, how would a machine identify an apple or an orange. Not surprisingly, it is based on the characteristics that we provide the machine with. It can be size, shape, weight etc. The more features we consider the easier it is to identify and distinguish both.
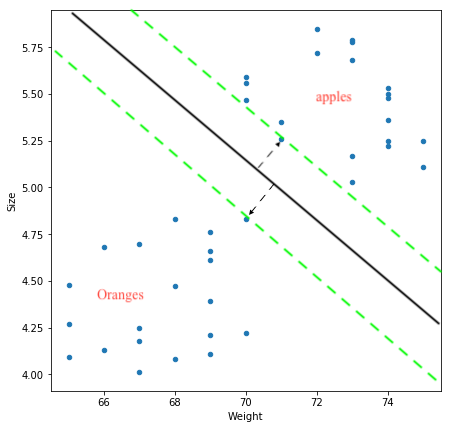
For the time being, we will just focus on the weight and size(diameter) of apples and oranges. Now how would a machine using SVM, classify a new fruit as either apple or orange just based on the data on the size and weights of some 20 apples and oranges that were observed and labelled? The below image depicts how.

The objective of SVM is to draw a line that best separates the two classes of data points.
SVM generates a line that can cleanly separate the two classes. How clean, you may ask. There are many possible ways of drawing a line that separates the two classes, however, in SVM, it is determined by the margins and the support vectors.
The margin is the area separating the two dotted green lines as shown in the image above. The more the margin the better the classes are separated. The support vectors are the data points through which each of the green lines passes through. These points are called support vectors as they contribute to the margins and hence the classifier itself. These support vectors are simply the data points lying closest to the border of either of the classes which has a probability of being in either one.
The SVM then generates a hyperplane which has the maximum margin, in this case the black bold line that separates the two classes which is at an optimum distance between both the classes.
In case of more than 2 features and multiple dimensions, the line is replaced by a hyperplane that separates multidimensional spaces.
Implementing SVM in Python
Now that we have understood the basics of SVM, let’s try to implement it in Python. Just like the intuition that we saw above the implementation is very simple and straightforward with Scikit Learn’s svm package.
Let’s use the same dataset of apples and oranges. We will consider the Weights and Size for 20 each. Click here to download the dataset or you can simply create a dataset of random values which are linearly separable.
Importing the dataset
import pandas as pd

data = pd.read_csv("apples_and_oranges.csv")
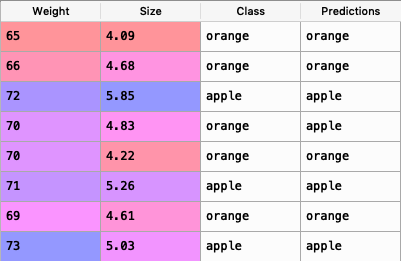
Here is what it looks like :

Splitting the dataset into training and test samples
from sklearn.model_selection import train_test_split

training_set, test_set = train_test_split(data, test_size = 0.2, random_state = 1)
Classifying the predictors and target
X_train = training_set.iloc[:,0:2].values

Y_train = training_set.iloc[:,2].values

X_test = test_set.iloc[:,0:2].values

Y_test = test_set.iloc[:,2].values
Initializing Support Vector Machine and fitting the training data
from sklearn.svm import SVC

classifier = SVC(kernel='rbf', random_state = 1)

classifier.fit(X_train,Y_train)
Predicting the classes for test set
Y_pred = classifier.predict(X_test)
Attaching the predictions to test set for comparing
test_set["Predictions"] = Y_pred
Comparing the actual classes and predictions
Let’s have a look at the test_set:

Comparing the ‘Class’ and ‘Predictions’ column we find that only one of the 8 predictions has gone wrong
Calculating the accuracy of the predictions
We will calculate the accuracy using the confusion matrix as follows :
from sklearn.metrics import confusion_matrix

cm = confusion_matrix(Y_test,Y_pred)

accuracy = float(cm.diagonal().sum())/len(Y_test)

print("\nAccuracy Of SVM For The Given Dataset : ", accuracy)
Output:
Accuracy Of SVM For The Given Dataset : 0.875
Visualizing the classifier
Before we visualize we might need to encode the classes ‘apple’ and ‘orange’ into numericals.We can achieve that using the label encoder.
from sklearn.preprocessing import LabelEncoder

le = LabelEncoder()

Y_train = le.fit_transform(Y_train)
After encoding , fit the encoded data to the SVM
from sklearn.svm import SVC

classifier = SVC(kernel='rbf', random_state = 1)

classifier.fit(X_train,Y_train)
Let’s Visualize!
import numpy as np

import matplotlib.pyplot as plt

from matplotlib.colors import ListedColormap

plt.figure(figsize = (7,7))

X_set, y_set = X_train, Y_train

X1, X2 = np.meshgrid(np.arange(start = X_set[:, 0].min() - 1, stop = X_set[:, 0].max() + 1, step = 0.01), np.arange(start = X_set[:, 1].min() - 1, stop = X_set[:, 1].max() + 1, step = 0.01))

plt.contourf(X1, X2, classifier.predict(np.array([X1.ravel(), X2.ravel()]).T).reshape(X1.shape), alpha = 0.75, cmap = ListedColormap(('black', 'white')))

plt.xlim(X1.min(), X1.max())

plt.ylim(X2.min(), X2.max())

for i, j in enumerate(np.unique(y_set)):

plt.scatter(X_set[y_set == j, 0], X_set[y_set == j, 1], c = ListedColormap(('red', 'orange'))(i), label = j)

plt.title('Apples Vs Oranges')

plt.xlabel('Weight In Grams')

plt.ylabel('Size in cm')

plt.legend()

plt.show()
Output :

The above image shows the plotting of the training set after fitting the training data to the classifier.The border that separates both the white and black colours represent the Maximum Margin Hyperplane or Line in this case.
According to the SVM classifier, any new data point that falls within the white region is classified as oranges(denoted in orange colour) and any data point that falls on black region is classified as apples(denoted in red colour).
Visualizing the predictions
import numpy as np

import matplotlib.pyplot as plt

from matplotlib.colors import ListedColormap

plt.figure(figsize = (7,7))

X_set, y_set = X_test, Y_test

X1, X2 = np.meshgrid(np.arange(start = X_set[:, 0].min() - 1, stop = X_set[:, 0].max() + 1, step = 0.01),np.arange(start = X_set[:, 1].min() - 1, stop = X_set[:, 1].max() + 1, step = 0.01))

plt.contourf(X1, X2, classifier.predict(np.array([X1.ravel(), X2.ravel()]).T).reshape(X1.shape),alpha = 0.75, cmap = ListedColormap(('black', 'white')))

plt.xlim(X1.min(), X1.max())

plt.ylim(X2.min(), X2.max())

for i, j in enumerate(np.unique(y_set)):

plt.scatter(X_set[y_set == j, 0], X_set[y_set == j, 1],c = ListedColormap(('red', 'orange'))(i), label = j)

plt.title('Apples Vs Oranges Predictions')

plt.xlabel('Weight In Grams')

plt.ylabel('Size in cm')

plt.legend()

plt.show()
Output:

In the above image we can see that one of the orange data points is lying outside of the whte region. This represents the false prediction that we saw earlier while comparing the actual test set classes and the predicted classes.


