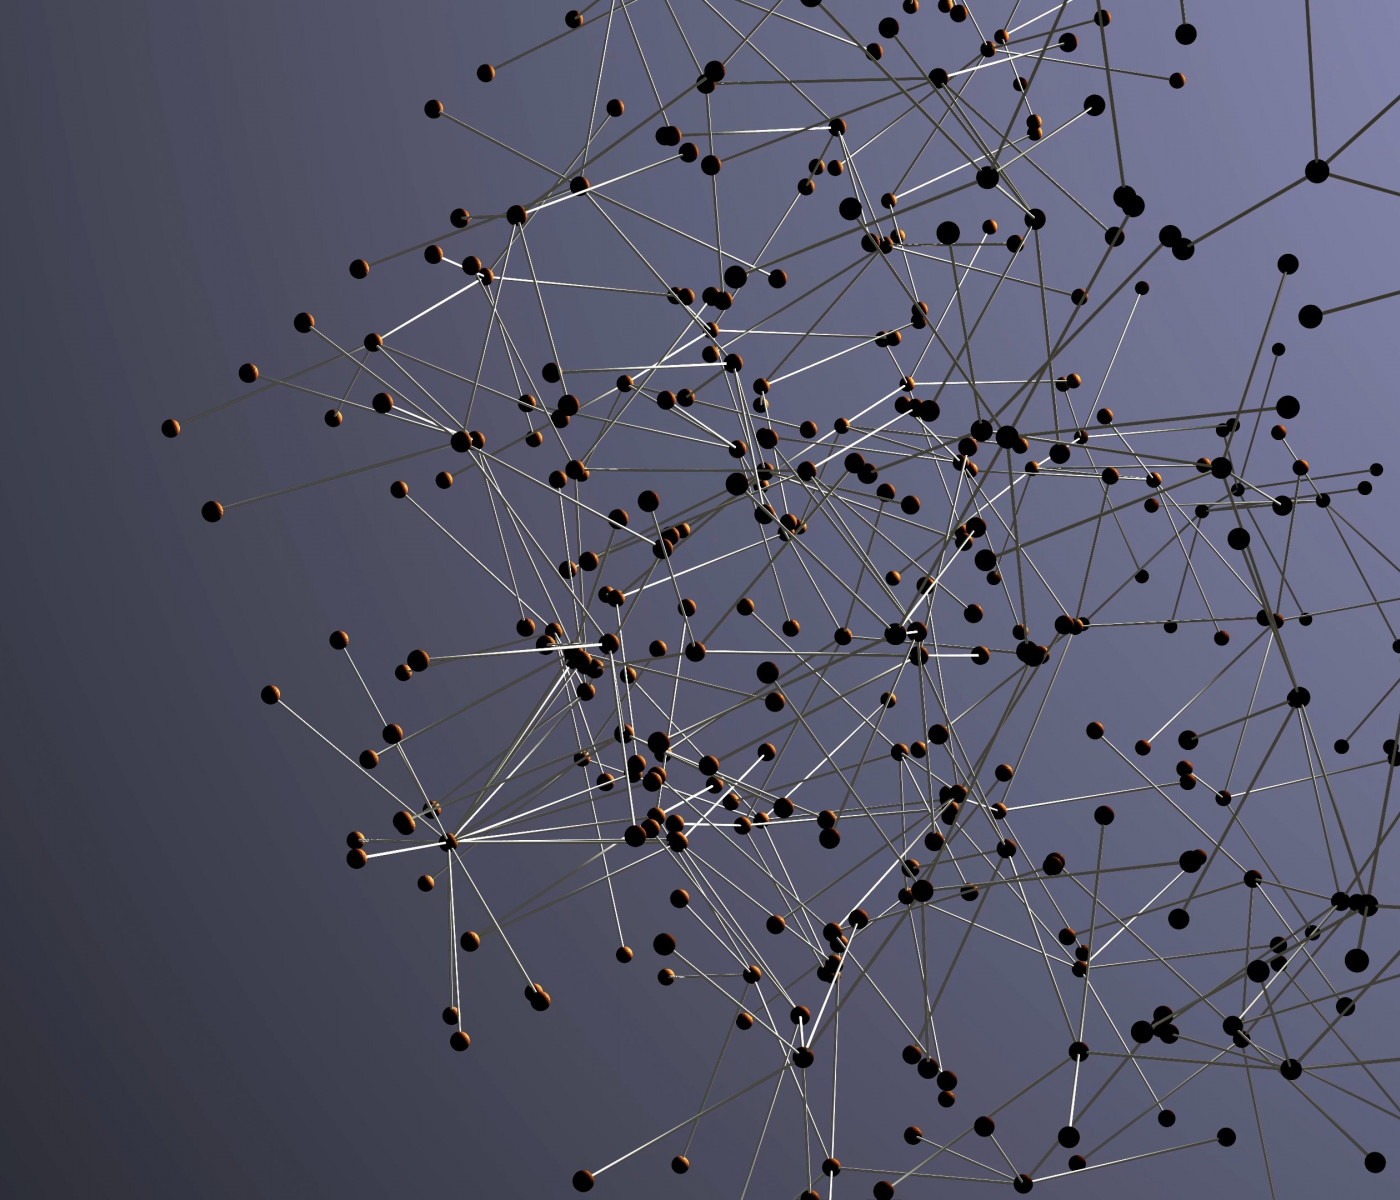
Relational data represent relationships between entities anywhere on the web (e.g. online social networks) or in the physical world (e.g. structure of the protein). Such data can also be represented as a graph with nodes (such as user, protein) and branches connecting them. To apply the machine learning methods to graphs one needs to learn a representation of the graph and the fundamentals associated with it. In this article, we will discuss the graph representation fundamentals in detail along with how machine learning can be performed using graph data. The major points that we will cover in this article are listed below.
Table of Contents
- What is Graph?
- Multi-Relational Graph
- Heterogeneous Graph
- Multiplex Graph
- Multi-Relational Graph
- Machine Learning with Graphs
- Feature extraction
- Graph for Various ML Methods
Let’s proceed with our discussion.
What is Graph?
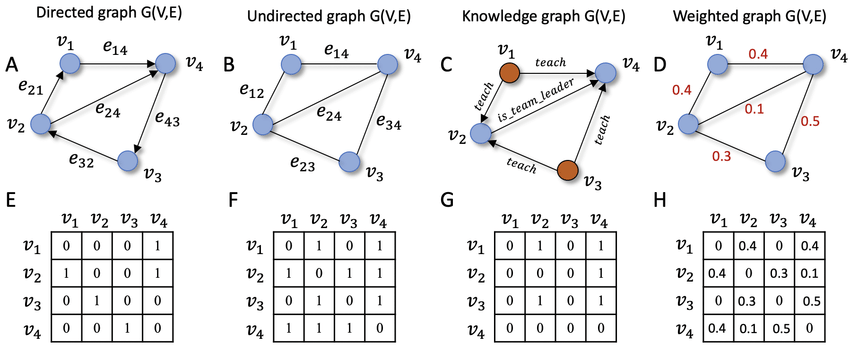
Let’s define graph data a bit more formally before we consider machine learning on graphs. There are nodes V and edges E that make up a graph G=(V, E). It is necessary to transform graphs into numerical forms before using them in any method. The use of adjacency matrices, laplacian, or degree matrices can help us attain this goal. If you want to define attributes of each vertex and link, you may use a feature vector.
An adjacency matrix is a useful way to represent a graph. We organize the nodes in the graph so that each node indexes a specific row and column in the adjacency matrix to depict a graph with an adjacency matrix. The existence of edges may therefore be represented as entries in this matrix.
If the graph contains any undirected edges then the adjacency matrix will be a symmetric matrix, but however, if the graph is directed means edge orientation becomes important then it is not necessarily symmetric. Some graphs also have weighted edges where entries in the adjacency matrix are arbitrary real values rather than {0,1}.
Multi-Relational Graph
In addition to the distinction between undirected, directed, and weighted edges we will look at graphs with different types of edges. For example in the graph depicting drug-drug interaction, we would want various edges to indicate various side-effects which can occur when we take a pair of medications concurrently. In this case, we can extend the edge notation to include the edge relationship type as τ and can define one adjacency matrix as Aτ.
Two important subsets of multi-relational graphs are heterogeneous graphs and multiplex graphs.
Heterogeneous Graph
In the heterogeneous graph, for example in biomedical, one type of node may represent proteins, another type of node could represent medication, and still another type could represent illness. Edges indicate ‘treatments’ and these would appear exclusively between medication and illness nodes. Similarly, edges denoting ‘polypharmacy side effects’ would appear only between two medication nodes.
Multiplex Graph
In a multiplex graph, we assume that the graph can be decomposed into a collection of k layers. Every node is considered to be a member of every layer, and each layer corresponds to a unique relation, which represents the intra-layer edge type of that layer.
For example, in a multiplex transportation graph, each node might represent a city and each layer might represent a different mode of transportation (air travel, road travel, rail travel). Intra layer edges would thus represent cities linked by various means of transportation, while inter-layer edges symbolise the ability to alter modes of transients inside a city.
Machine Learning with Graphs
Machine learning with the graph is no longer an exception, although the traditional classification of supervised and unsupervised is not always the most informative or useful when it comes to the graph. Let us understand it with an example
Assume we are given huge social network data including millions of individuals, but we know that a significant proportion of these users are bots. Identifying these bots is essential for a variety of reasons including the fact that the firm may not wish to promote bots. Manually evaluating each user to identify whether they are a bot or not would be prohibitively expensive therefore we would like to create a graph model that could categorize users as a bot or not bot.
Feature Extraction
The primary goal of feature extraction for graphs is to convey information about local and global graph structure in a more accessible, vector-like manner. We are as interested in obtaining information about the characteristics of single vertices as we are in obtaining information about the connection between them. Graph characteristics may be classified into three types: node level, graph level, and neighbourhood overlap features.

We intend to produce a feature vector for each vertex for node-level features. Node degree, centrality technique, and clustering coefficients are some of the most common feature extraction methods. To compute these characteristics, we can utilize information from vertex’s immediate neighbours or from a more distant, k-hop neighbourhood.
We potentially take a broader approach to develop a feature for the entire graph. It is referred to as a graph-level feature. It is possible to do so using fundamental features such as the Adjacency matrix as well as some sophisticated iterative techniques such as Weisfeiler-Lehman or Graphlet kernels.
Neighbourhood overlap features are the final form of feature extraction for graphs. They are specially intended to retrieve information regarding node connections. They are further classified as local and global techniques. The former indicates the similarity of two nodes’ neighbourhoods, whereas the latter describes whether a specific node inside a network belongs to the same community.
Graph for Various ML Methods
The large category of common machine learning applications on graph data comprises classification, regression, and clustering. For example, given a graph depicting the structure of a molecule we could wish to create a regression model that predicts the toxicity or solubility of that molecule.
Or we might want to build a classifier to detect whether a computer program is malicious by analyzing the graph-based representation of its syntax and data flow.
Instead of generating predictions over the various components of a single graph, such as nodes and edges, we are given a dataset of numerous separate graphs and our goal is to generate independent predictions relevant to each graph. The purpose of graph clustering, a related job, is to develop an unsupervised measure of graph similarity between pairings.
Graph regression and classification are perhaps the most straightforward analogues of standard supervised learning of all machine learning tasks on graphs. Each graph is data points linked with labels and the objective is to learn a mapping from data points i.e., graph to labels using a labelled set of training points.
Similarly, graph clustering is a simple extension of unsupervised clustering for graph data. The difficulty with these graph-level jobs is defining meaningful characteristics that take into consideration the relation structure inside each datapoint.
Final Words
In this article, we have taken a tour across necessarily to be known concepts such as what actually is a graph, its types along with how machine learning can be used to solve problems using graphs and how features can be extracted from the graphs.


