Article complete

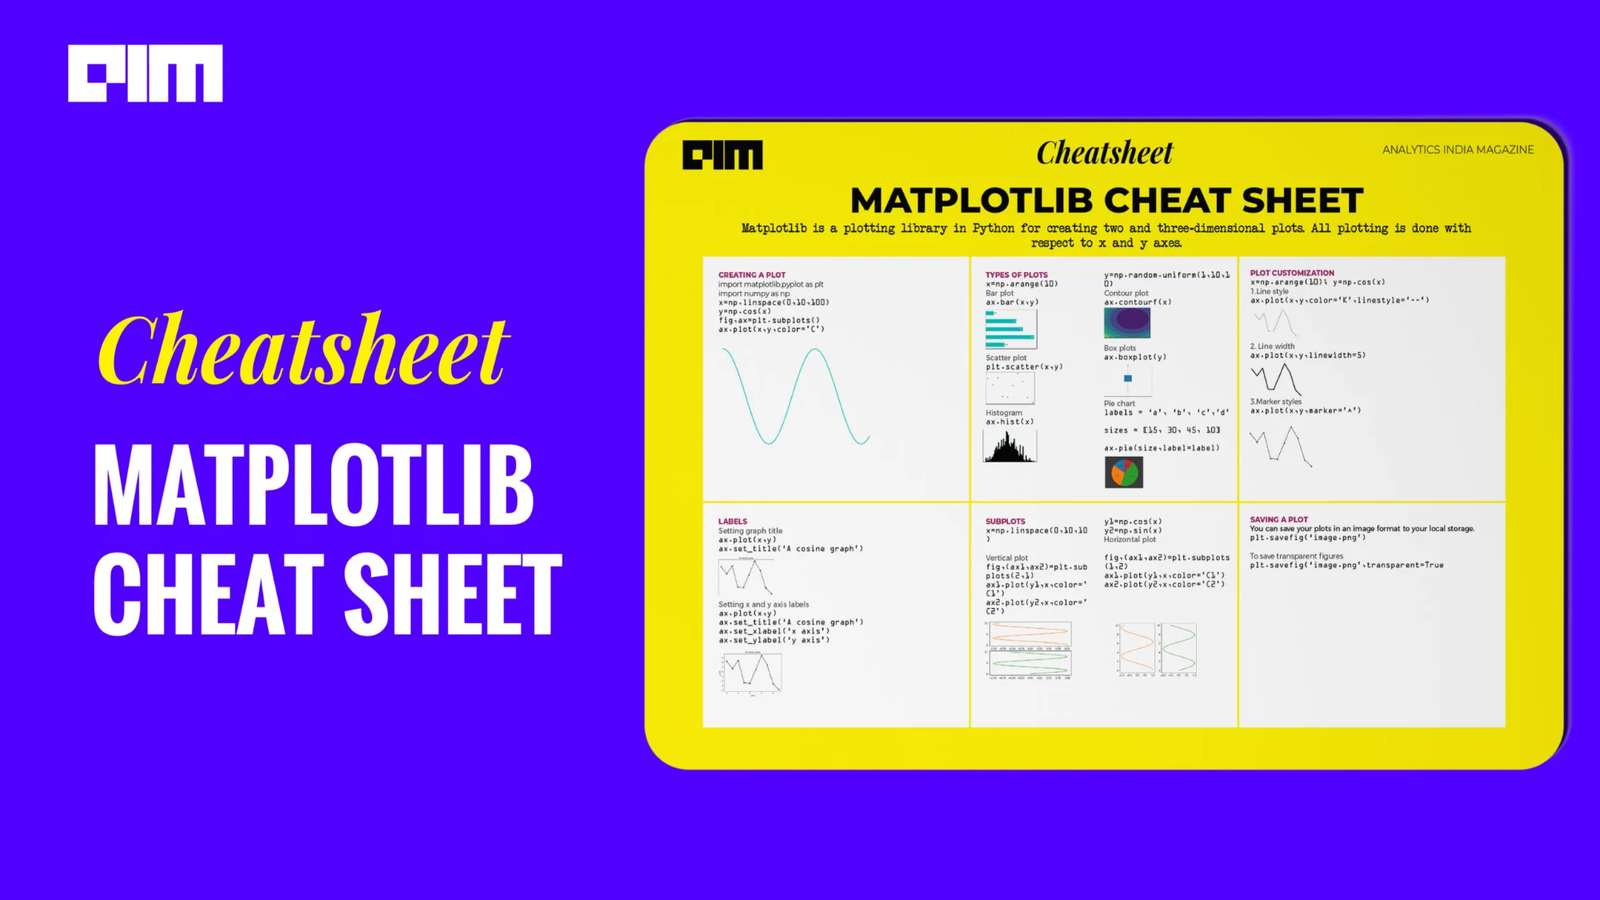
CheatSheet | MATPLOTLIB

CheatSheet | MATPLOTLIB

Key takeaways

  • Matplotlib is a Python library used for creating two and three-dimensional plots.
  • All visualisations in Matplotlib are based on the x and y axes.
  • The library offers extensive capabilities for data visualisation and analysis.

Takeaways drafted with AI from the article text.

To download the cheatsheet, please login below and follow our Facebook Page.


Published

Spotted an error? Tell our editors. Read our editorial standards and corrections.

More in this story

Matplotlib · 5 stories
  1. Machine Learning Hacks: Cheatsheets, Codes, Guides And Walkthrough
  2. Comparing Python Data Visualization Tools: Matplotlib vs Seaborn
  3. 10 Free Resources To Learn Matplotlib
  4. You are here: CheatSheet | MATPLOTLIB
  5. Python’s Pandas vs Polars: Who Wins this Fight in Library 
About the author

Contributor

Since 2012, AIM has been chronicling the technological progress in artificial intelligence by highlighting the innovations, key players, and challenges shaping the future of our world. Through dedicated journalism, we promote and discuss ideas from smart, passionate, action-oriented individuals who strive to change the world.

All stories
Belamy · Daily

The day’s AI news, before your first meeting.