
5 min
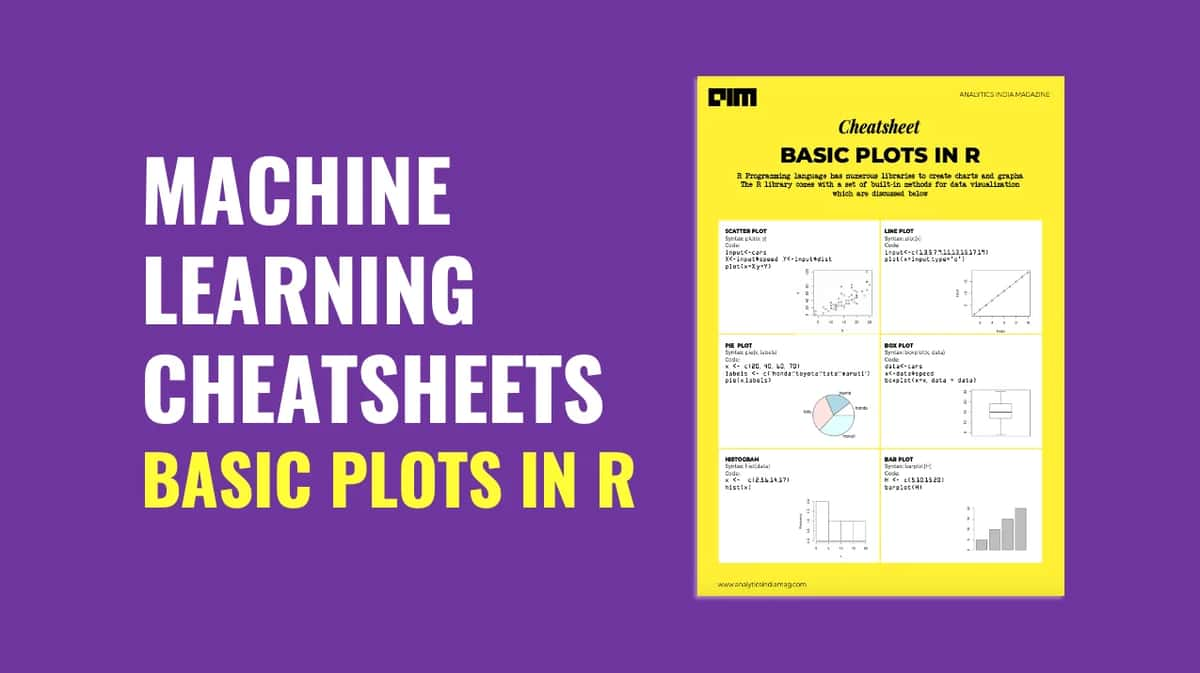
R Programming language has numerous libraries to create charts and graphs.
The R library comes with a set of built-in methods for data visualization
which are discussed below.
- The AI Slowdown Narrative Doesn’t Reflect Enterprise Reality
- India’s Enterprises are Scaling AI. Is the Infrastructure Ready?
- Industry Wants Faster Approvals and Cheaper Power in India’s Data Centre Policy
- Inside Jio Platforms: Its Tech Bets, Loss-Making Subsidiaries and Hidden Risks
- India’s GCCs to Add 1.4 Million Jobs, Drive 170 Million Sq. Ft. Office Demand by 2031
- AI Can Be Cyborg or Centaur. But Can Enterprises Monetise It?