

5 min
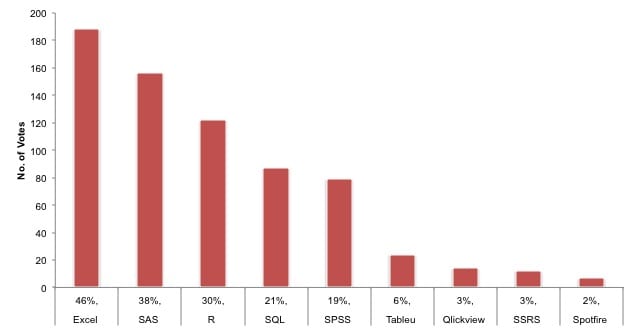
We ran the poll from 15th Sep, 2013 to 26th Oct, 2013 and received 403 responses.
Here’s a synopsis of the poll results-
Total Days Poll Ran: 42 Days
Total Voters: 403
Total Votes: 688 (This was multiple selection poll)
Average votes per voter: 1.7
 Editor’s comments:
 Editor’s comments:
- The poll intuitively makes sense. Excel should be at the top to be utilized most as an analytics tool.
- SAS continues to be the preferred statistical tool used by analytics professionals.
- R is bridging the gap with SAS and come close to be the third most used analytics tool.
- SPSS is lagging since been acquired by IBM. Comes at 5 position.
- Visualization tools ( Tableau, Qlikview, SSRS and Spotfire) comes at the bottom. One reason for their lower penetration may be high cost of ownership for just visualization capabilities. Excel continues to be the preferred visualization tool in the industry.
- India’s Accessibility Rules are Forcing Software and App Design Rethink
- Succession, Scrutiny, and the Future of NVIDIA
- Can You Trust Your ‘Instinct’ and Not ‘Muse’ Over the Risks?
- Is AI-Powered Reverse Engineering the Death of Proprietary Software?
- Smaller Language Models Could Reshape How Enterprises Deploy AI
- Enmovil Plans to Quadruple FDE Team as Enterprise AI Hiring Moves Beyond Coding