The application of data mining and analysis techniques is not new to football. However, it has not been exploited to its potential by football clubs in India.
A team of Industrial Engineering students from College of Engineering Trivandrum, completed a project on Football Analytics. The football analytics system developed includes methods for data collection from matches, algorithms to extract meaningful results and patterns of play from the data and methods of visualization of the findings. The patterns in passing and movement of players can be used as a tool for building the right strategy against the opposition. This vital information about the team and players makes the difference between winning and losing.
Attached below is the report of the match between Atletico Paranaense and Shamrock Rovers which was analysed using this system.
MATCH REPORT (FIRST HALF)
ATLETICO PARANAENSE vs SHAMROCK ROVERS
Match : 1st Semi-final
Time : 19:00 hrs
Date : 18 February, 2016
Venue : EMS Corporation Stadium, Kozhikode, Kerala
Tournament : Sait Nagjee International Club Football 2016
The algorithms when implemented on the datasets collected gave the following results:
- GENERAL STATISTICS
Total Passes in first half : 335
Atletico Paranaense:
- Total Passes : 338 (63.2%)
- Successful passes : 273 (80.77%)
- Failed passes : 65 (19.23%)
- Very short passes : 44 (13%)
- Short passes : 164 (49%)
- Long passes : 102 (30%)
- Long overhead pass : 28 (8%)
Shamrock Rovers:
- Total Passes : 197 (36.8%)
- Successful passes : 134 (68.1%)
- Failed passes : 63 (31.9%)
- Very short passes : 20 (10%)
- Short passes : 90 (46%)
- Long passes : 55 (28%)
- Long overhead pass : 32 (16%)
PASSES VISUALISATION OF ATLETICO PARANAENSE
All the passes made in a match can be visualised, helping teams and players know their strengths and weaknesses in passing. Different passes visualisation have been done by classifying passes on the basis of outcome of the pass, the player that makes the pass, the type of pass based on distance of the pass namely very short pass, short pass, long pass and long overhead pass.

- Center defenders : Players 3 and 13
- Wing defenders : Players 2 and 6
- Midfielders : Players 5 and 17
- Forwards : Players 8, 10 and 16
- Striker : Player 11
- Successful Passes : Blue colour
- Failed Passes : Red colour
Base on length of passes:
- Very short passes : less than 7 meters
- Short passes : 7 to 21 meters
- Long passes : greater than 21 meters
PASSING COMBINATION
Passing combination identifies the number of passes made between different players of the same team and can reveal the passing patterns of a player, who he passes to and from whom he receives passes frequently. The rows represent the player at the ‘from’ end of the pass and columns represent the player at the ‘to’ end of the pass.
Table 1: Passing combination of Atletico Paranaense
| – | 1 | 2 | 3 | 5 | 6 | 7 | 8 | 10 | 11 | 13 | 16 | Total |
| 1 | – | 0 | 12 | 0 | 3 | 0 | 3 | 0 | 0 | 11 | 1 | 30 |
| 2 | 3 | – | 2 | 3 | 0 | 6 | 0 | 9 | 5 | 8 | 11 | 47 |
| 3 | 6 | 5 | – | 6 | 14 | 1 | 4 | 1 | 0 | 2 | 1 | 40 |
| 5 | 2 | 0 | 4 | – | 7 | 2 | 5 | 7 | 2 | 1 | 3 | 33 |
| 6 | 2 | 0 | 8 | 4 | – | 4 | 15 | 3 | 6 | 2 | 1 | 45 |
| 7 | 0 | 9 | 1 | 3 | 4 | – | 2 | 6 | 1 | 0 | 2 | 28 |
| 8 | 0 | 1 | 3 | 6 | 3 | 0 | – | 7 | 6 | 0 | 1 | 27 |
| 10 | 0 | 3 | 0 | 1 | 3 | 5 | 1 | – | 5 | 0 | 4 | 22 |
| 11 | 0 | 5 | 0 | 1 | 3 | 1 | 2 | 3 | – | 0 | 1 | 16 |
| 13 | 8 | 10 | 2 | 0 | 0 | 4 | 1 | 0 | 2 | – | 2 | 29 |
| 16 | 0 | 8 | 1 | 2 | 1 | 1 | 2 | 1 | 1 | 1 | – | 18 |
| Total | 21 | 41 | 33 | 26 | 37 | 24 | 35 | 37 | 28 | 25 | 27 | 335 |
DISTANCE AND SPEED OF PLAYERS
The distance run by and speed of the players were calculated using algorithms from the tracking data of a few minutes.
Table 2: Distance run and average speed of players of Atletico Paranaense
| Player Jersey number | Distance in meters | Speed in meters/second |
| 1 | 202.9433 | 1.514502 |
| 2 | 664.7807 | 4.96105 |
| 3 | 640.4198 | 4.779252 |
| 5 | 745.5503 | 5.563808 |
| 6 | 917.0595 | 6.843727 |
| 7 | 809.5459 | 6.041387 |
| 8 | 698.2302 | 5.210673 |
| 10 | 829.2694 | 6.188578 |
| 11 | 691.8664 | 5.163182 |
| 13 | 546.4314 | 4.077846 |
| 16 | 674.6228 | 5.034499 |
Speed profile of a player shows the sprints made by the player during the game. Gradual dip in the average speed values towards the end of the game for ageing players can be used to substitute them.
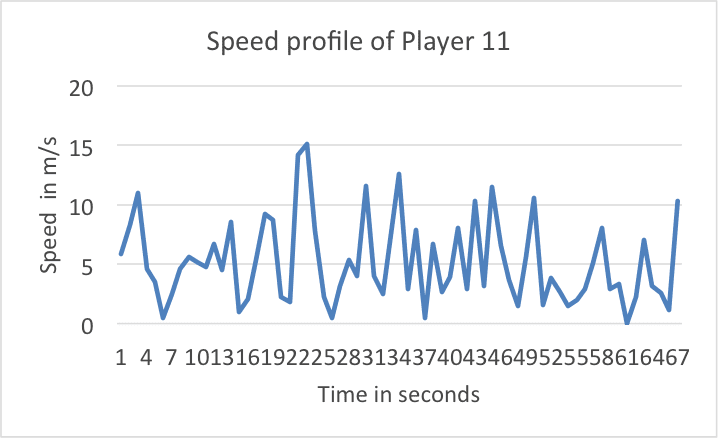 Fig 4: Speed profile of Player 11 of Atletico Paranaense
AVERAGE TEAM FORMATION
Team formation is the arrangement of players of a team on the field. The formation varies depending on the strategy of the team. The team formation of Atletico Paranaense for this match was 4-2-3-1.
Even though the players have an assigned region to play, it was found they move significantly from their positions. The average team formation can plot their mean position of play.
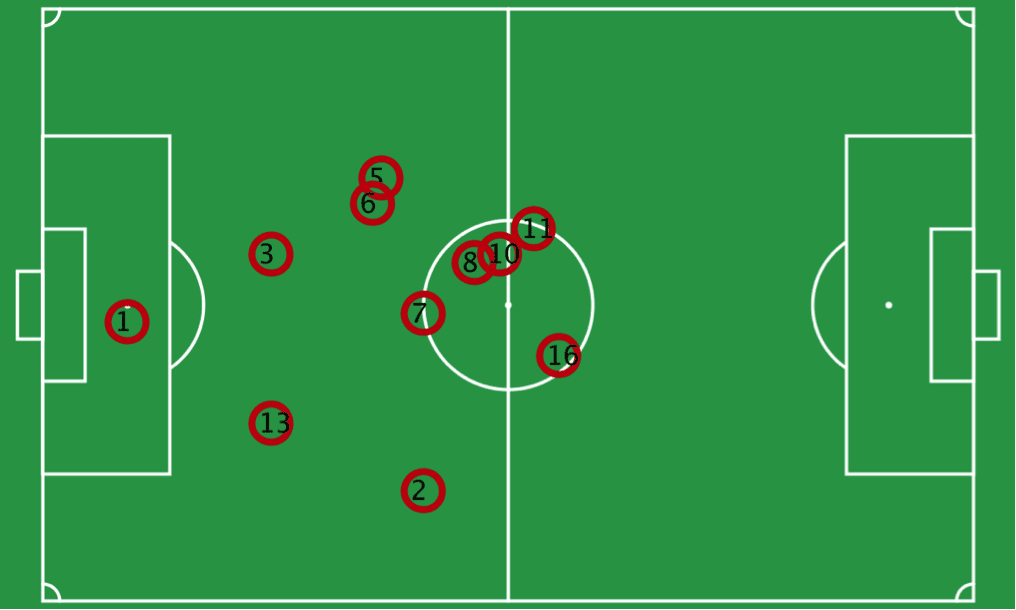 Fig 5: Average team formation of Atletico Paranaense
The statistics generated reveals areas of strength and weaknesses of the team. The visualisation of passes show patterns of play of the team and the players. The distance run by players and their speed profile can be used to substitute the players that show a below average performance. The passing combination reveals the sync between different players around whom the game revolves.
[divider]
AUTHOR INFO:
Sushant T. Eapen (eapen.sushant@gmail.com)
I did this project on Football Analytics out of my passion for football, analytics, coding and sports photography. Quite a crazy combination!
The other members of my team that did this project are:
- Cyriac Pius
- Harikrishnan Menoth
- Navaneeth K S