

5 min
In the Machine Learning spectrum, Binary Classification is one of the simplest and most popular problems that has been widely used across domains. From identifying fraudulent bank transactions to classifying or diagnosing diseases, Binary Classifiers have been in use since the inception of Machine Learning.
Many classification algorithms like Logistic Regressor uses probability to distribute samples into classes and in most cases the probability threshold defaults to 0.5. Which means that the algorithm classifies a sample as positive if the probability of that sample being positive is above 0.5(50%) and classifies a sample as negative if the probability of that sample being positive is less 0.5(50%)
This default threshold may not be enough when we consider a variety of problems that demand otherwise, say for example while diagnosing a disease it may be wise to choose a lower probability threshold to prevent any chance of the disease going misclassified. Thus the classification of critical data demands a more custom threshold which meets certain requirements. This is where the Receiver operating characteristic Curve shortly known as the ROC curve comes into play. It illustrates the diagnostic ability of a binary classifier.
In layman's terms, the ROC curve visualises the effect of a chosen probability threshold on the classification efficiency. It helps analyse how the efficiency of Binary Classification changes with the values of Probability threshold.
 Consider a simple classification problem where the objective is to classify fraudulent and non-fraudulent transactions. Class 1 will be the positives which are the Fraudulent transactions and Class 2 will be the negatives or the non-fraudulent transactions.
Then,


 We plot the (TPR, FPR) for different values of the probability threshold to obtain the ROC curve.
The Confusion Matrix
The simplest way to analyse classification efficiency is by creating a Confusion Matrix with the predicted outcomes. The Confusion Matrix is also known as the Error Matrix as it determines the error rate in a classification prediction. The following image represents a Confusion Matrix.
Consider a simple classification problem where the objective is to classify fraudulent and non-fraudulent transactions. Class 1 will be the positives which are the Fraudulent transactions and Class 2 will be the negatives or the non-fraudulent transactions.
Then,
- True Positive(TP) is the number of predicted fraudulent transactions that are actually fraudulent transactions.
- True Negative(TN) is the number of predicted non-fraudulent transactions that are actually non-fraudulent transactions.
- False Positive(FP) is the number of non-fraudulent transactions which were incorrectly classified as fraudulent transactions.
- False Negative(FN) is the number of fraudulent transactions that were incorrectly predicted or classified as non-fraudulent transactions.
Plotting The ROC Curve
The ROC curve can be plotted using the Confusion matrix as follows. The ROC curve is created by plotting the True Positive Rate (TPR) against the False Positive Rate (FPR) of a classification problem for various probability thresholds. Lets us understand each of these terms.False Positive Rate
False Positive Rate (FPR) also called fall out is the ratio of negative samples which are incorrectly classified. For example, if we consider the bank transaction example stated above, the False Positive Rate is the ratio of non-fraudulent transactions that were incorrectly classified as fraudulent transactions. It can be calculated as follows:
True Positive Rate
True Positive Rate(TPR) also called as sensitivity, recall and hit rate is the ratio of Positive samples which were correctly classified. It can be calculated in the following ways. True Positive Rate gives the ratio of fraudulent transactions which were correctly classified as fraudulent by the classifier.
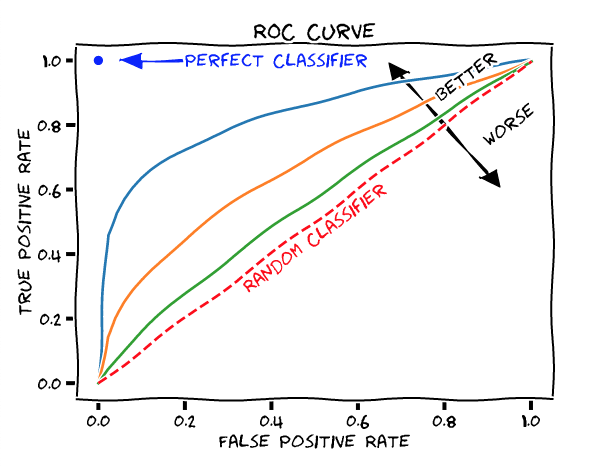
 We plot the (TPR, FPR) for different values of the probability threshold to obtain the ROC curve.
- In the above figure, the red line indicates the points where the TPR and FPR are equal and any point on the line suggests that the ratio of correctly classified Positives is the same as the ratio of incorrectly classified Negatives which is only as good as a random classifier.
- Any point above the red line is better than a random classifier.
- Any point to the left of the red line indicates that the ratio of true positives are greater than that of false positives indicating a better probability threshold as the point moves towards left.
- The blue, orange and green lines represent ROC curves. Since the blue line is further away from the random classifier, it represents a better classifier in terms of efficiency.
- The blue dot represents a perfect classifier. At coordinate (0,1) the FPR is 0 and TPR is 1, meaning that all the positives are correctly classified and no negatives are incorrectly classified. Simply this means that there are no incorrect predictions at all.
Closing Note
The ROC Graph thus provides a summary of all the Confusion matrices generated with different probability thresholds and helps us choose the right probability based on the required/acceptable False Positives.- From Humanoid Robots to Telecom Trials, 12 Major Announcements at NVIDIA GTC Berlin 2026
- Anyone Can Make a Robot Move, Few Can Make It Stop
- After ISRO’s PSLV Failure, TakeMe2Space Looks to SpaceX for Reliable Launch
- Why AI Agents are the Next Frontier in Quantum Security
- Physical AI Squeezes Labour Market, And Low-Skilled Immigrant Jobs May Be First to Fall
- Rocket Math Isn’t Mathing: Why India’s Space Launches are Expensive