Key takeaways
- Netflix aims to enhance content and performance while making improvements open-source for wider developer access.
- FlameScope is a new visualisation tool introduced to tackle performance issues within Netflix's microservices.
- The tool provides CPU performance analysis and visual representations using flame graphs and heat maps.
- FlameScope helps identify performance issues by depicting various time-dependent factors affecting application performance.
 The Netflix team is always striving towards bringing more power in terms of its content and performance. They also make most of their improvements open-source, such as their latest software and tools so that users and developers outside can modify or debug problems related to performance and make it better.
In a latest development, the Netflix team has introduced FlameScope to specifically address performance issues occurring at one of its microservices. FlamseScope is a visualisation tool which analyses performance at the CPU level. It also analyses various time-dependent factors such as variance, perturbations, app startup, and many others. This is visually depicted using “flame graphs” by combining another visualisation tool called heat maps. The CPU load profile is presented in the form of these heat maps to access performance issues quickly.
How Does FlameScope Work: Understanding Subsecond Offset Heat Maps
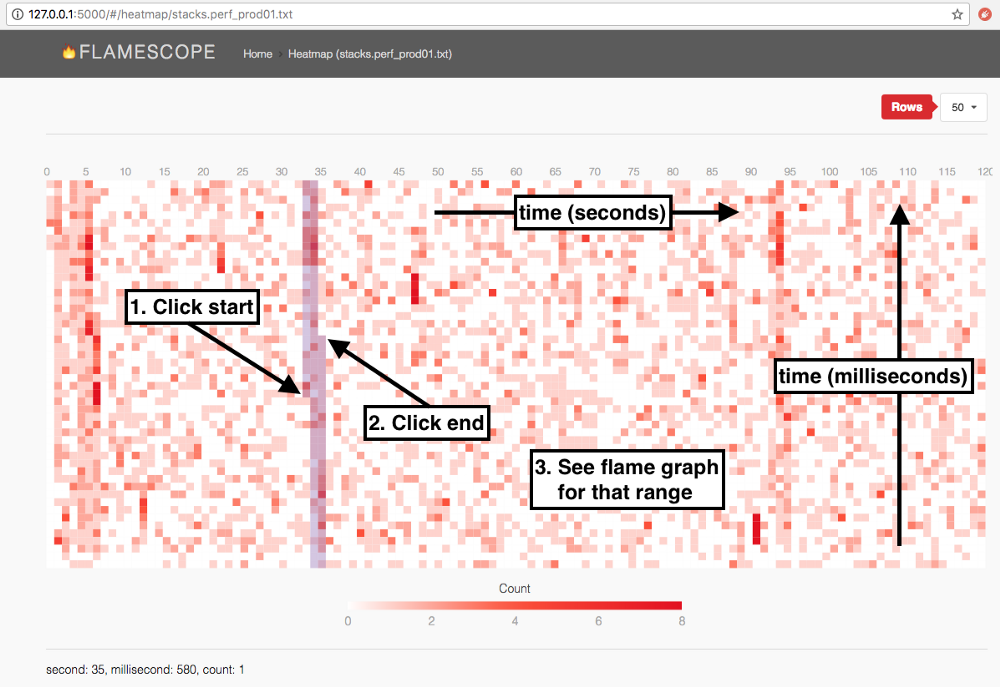
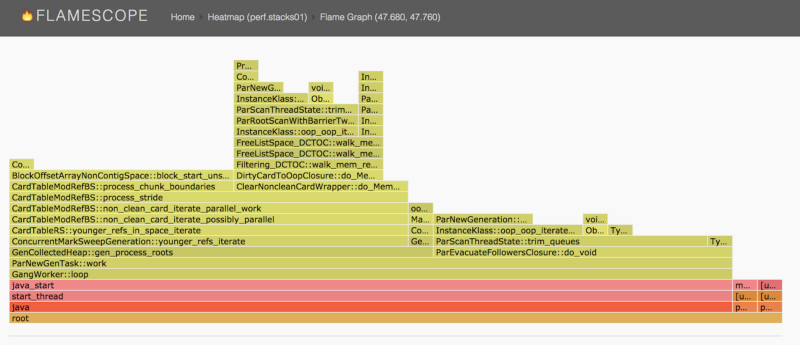
Flame graphs and heat maps mentioned in the previous paragraph forms the core part of performance visualisation. In this section, a distinct aspect called Subsecond Offset Heat Maps (SOHM) from Netflix is explored. SOHM is derived by studying heat maps and flame graphs. Heat maps are used to visualise large amounts of three-dimensional data on the servers, where time is plotted on x-axis, disk input/output (I/O) latency (time on a fractional scale) on y-axis and the frequency of disk I/O as color intensity. This means, color acts as a dimension. Now, flame graphs show software code paths which visually look like a flame, and covers a profile (here, CPU profile) usually for a minute. SOHM is obtained by selecting a section of that minute (seconds or milliseconds) of heat map upon which flame graphs are depicted/invoked instantly. That is to say, flame graphs are embedded into heat maps to assess smaller variations that fall within a minute’s time-frame. Therefore, the data is displayed as a heat map which show various patterns which the user can work with to resolve performance issues. The following snapshot shows the selection of a time range in FlameScope, which highlights an instance of CPU profile