This is the second installation in a series of articles on Customer Life Stage modelling. The first article has been published at https://analyticsindiamag.com/part-1-customer-life-cycle-a-misleading-term/ .
In the earlier article, I highlighted the difference between Customer Life Cycle and Customer Life Stage. The article also listed 8 dimensions along which the Customer Life Stage can be defined. These dimensions may not be a comprehensive list but in my experience they are more than sufficient.
This article will attempt to create a sample Customer Life Stage model. We will use three dimensions for our sample. A one dimensional model does not make much value addition. A two dimensional model simplifies the approach into a comfortable analysis. Anything more than 3 dimensions may make it difficult to visualize. So, we will stick to the geometry that everyone is comfortable with - A cube. I also recommend that you adopt a three dimensional approach when embarking on a Customer Life Stage modelling. When you reach a maturity with this model, you may attempt to add a fourth dimension to the Customer Life Stage definition.
For our purpose, we will consider a banking scenario and consider the following three dimensions:
- Vintage: Vintage is defined as the time the customer has been on books of the company, stated in months. A telco would term this as month on books.
Product Holding: Product holding dimension aims at listing the products held by the customer. I will be discussing this dimension later in this article.
Product Value: Product value defines as the value of the product. Since, different products have different value, it is necessary to arrive at a normalized definition of the value so that it can be summed up over all products. For example, a bank could consider net revenue spread from product holding. A telco could consider expensed value of services.
Before we proceed, let’s approach the method to arrive at the values for the product holding dimension. At the basic, the set of values should be individual products, say, Savings Account, Current Account, Deposit, Credit Card, Loan. Next we need to find the commonly occurring combination of products. This is where we will cross over into statistical domain.
While I attempt to keep it simple, kindly go to http://en.wikipedia.org/wiki/Association_rule_learning if you need more information. Consider, we have 5 customers with the following holding across four products.
| Customer |
Savings Account (SA) |
Deposit(DP) |
Credit Card(CC) |
Loan(LN) |
| Customer 1 |
1 |
1 |
0 |
0 |
| Customer 2 |
0 |
0 |
1 |
0 |
| Customer 3 |
0 |
0 |
0 |
1 |
| Customer 4 |
1 |
1 |
1 |
0 |
| Customer 5 |
0 |
1 |
1 |
0 |
Let us first consider 2 product combinations: SA – DP (2 nos), SA – CC (1 nos), DP – CC (2 nos).
Considering 3 product combinations: SA – DP – CC (1 nos)
Taking each of these combinations, we have the following list of values for the product holding dimensions:
- SA
- DP
- CC
- LN
- SA – DP
- SA – CC
- DP – CC
- SA – DP – CC
We may decide to filter this list further. For example, a bank may decide only to lend to customers who hold savings account. So, loans can be taken out as a stand-alone value since no customer will have only loans. We may also set a threshold for occurrence of the combinations of product holding. Say, any combination that is less than 2% or less than 200 occurrences may be filtered out. In our example, we will ignore all combinations that is less than 2 occurrences. So, we now have the following selected values:
- SA
- DP
- CC
- SA – DP
- DP – CC
We will not get into concepts of confidence and support definitions here. See the link above for more info on these.
The list of values for vintage could be:
- 0 to 6 months
- 6 to 12 months
- 12 to 24 months
- 24 + months
The list of values for product value could be:
- 0 to 1K
- 1K to 10 K
- 10K to 50 K
- 50 + K
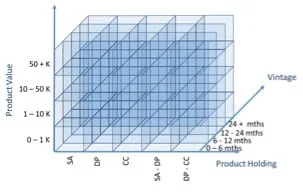
Now the Customer Life Stage model is a three dimensional model containing 80 possible stages ( 5 product holding x 4 vintage x 4 product value ).
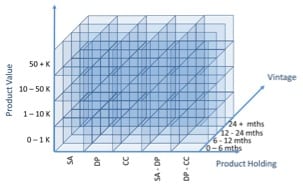
A customer may be in any of these stage cells. In the next article, we will aim to traverse this space and draw up the customer life stage models.


Your reaction
Discussion
What's your take on this story?
No comments yet — be the first to share your view.