For a Data Scientist, Data is the world and exploring it can give insights and help in understanding it better. Data exploration is a critical phase in any data specific problem and is also a skill that every Data Scientist should possess. It profiles the ability and curiosity of the Data Scientist who performs it. Having said that there are numerous ways in which one can understand data.
It obviously depends on one’s logic or experience and prior knowledge. Most of us have a tendency to rely on our logic to implement functionality without even bothering to know about an existing library or method which provides the exact same functionality or maybe we already knew and we just forgot that such a library existed. It is possible to forget a library that we don’t use often but can be a game changer when used at the right time.
It is nearly impossible to keep track of all those helpful libraries and methods unless we work with them on a regular basis which may not always be possible as each project we work with varies with time.
So here in this article, I will put down some of the simplest and most helpful packages or methods that make the process of exploring and manipulating data easy.
Getting The Dataset
All the examples shown below uses datasets from the Hackathons at MachineHack. To download the datasets, go ahead and sign up at Machinehack and start a hackathon.
Here is a glimpse of the dataset from Predicting The Costs Of Used Cars – Hackathon By Imarticus Learning which we will be using as we go along:
import pandas as pd
data = pd.read_excel("Participants_Data_Used_Cars/Data_Train.xlsx")
print(data.head())

Data Set Description
When we get a data set in hand most of us jump right ahead to explore it by printing the shape of the dataset, printing the columns in the dataset and doing all sorts of such things. However a simple method by pandas shows most of the details in one go. The DataFrame.describe() method describes the specified dataset.
data.describe(include ='all')
Output:

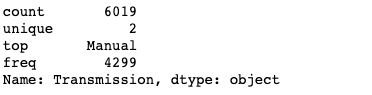
The method can also be applied to individual features (pandas.Series) in the dataset as shown below.
data['Transmission'].describe()
Output:
Describe as category
Though the pandas dataframe is well capable of understanding the types of data in each column, sometimes it often confuses itself or maybe we wish to see the data in a different context. Say, for example, the year in the dataset above is a numerical feature, however year as a categorical feature would make more sense to us while describing it.
At times like this, we can convert the type of a feature into category or numerical as desired. See the example below.
data['Year'].astype('category').describe()
Output:

Number of observations Per Category
This is very useful information given a classification or clustering problem. Identifying if the dataset is balanced or not can help in engineering the features and building an effective model. The value_counts() method will count the number of observations for a specified categorical feature.
data['Location'].value_counts()
Output:

Number Of Missing Data Points Per Feature
Knowing the missing data points is a critical piece of information that can help in determining how to impute values. The one-liner code shown below will output the number of missing data points in each column or feature.
data.isnull().sum()
Output:

Merging Dataframes Based on a common feature or column
One with an SQL background may be familiar with all the different types of ways two tables can be merged. This feature is extremely useful when handling relational datasets. In pandas merging can be achieved with a simple method called merge().
The below code block merges two dataframes easily based on a common feature on both datasets.
d1.merge(d2, how='inner', left_on='id', right_on='ID')
Here d1 and d2 are 2 different dataframes with a common feature ‘id’. The above command would merge the d2 dataframes to d1 based on matching id from both the dataframes.
Masking
Sometimes during data exploration, we might need to pick out a specific piece of data from a large dataset. While database languages like SQL allow querying based on specified conditions, the pandas dataframes also comes with a similar feature called masking.
The below line of code picks out only those observations where the Fuel_Type is CNG
data[data['Fuel_Type'] == 'CNG']
Output:

Transforming The datasets
Dataset manipulation is as easy as it can be, thanks to pandas it is possible to apply any method across data in an instant with the apply method. See the example below. A similar method called transform allows us to apply multiple functions or transformations across the features of the dataset.
The below code block returns a series after applying the lower() method to all the values in the column Name. The original dataframe is preserved.
data['Name'].apply(lambda x: x.lower())
Output:

Manipulating A Range of Observations
Pandas dataframe allows us to easily manipulate data within a dataframe. The scope of the manipulation can be selected by specifying a range. See the example below.
Let’s replace all the values until the 5th row with ‘NaN’
import numpy as np
data[0:5] = np.nan
Output:

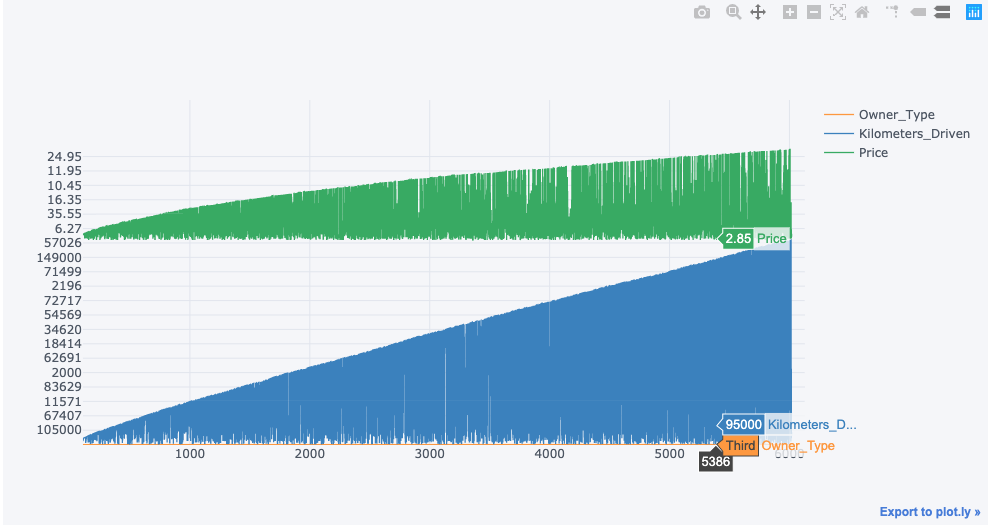
Interactive Plotting
It’s hard to resist adding some colourful information when all we have are some tables and texts. There are a variety of plotting libraries available, however, when we consider interactive plotting on the go, that can be a hand full on its own. But for those who use notebooks for their works, interactive plots can easily be achieved with a couple of libraries and a simple method called iplot().
import cufflinks as cf

import plotly.offline

cf.go_offline()

cf.set_config_file(offline=False, world_readable=True)

data[['Owner_Type' ,'Kilometers_Driven', 'Price']].iplot()
Output:
The Complete Dataset Profiler
The rise in popularity of Python in Machine Learning is mainly because of the abundance of library and support from a huge community. Almost every required functionalities and tool kits are packaged and can be executed just by calling the name of a method. For those who use ipython notebooks, a library called the pandas_profiling single-handedly does most of the Data Exploration task for you. As the name suggests the library profiles any dataframe and generates a complete HTML report on the dataset which includes a lot of information on the dataset and its features.
import pandas_profiling
data.profile_report()
Output:


These are some of the useful libraries and methods that make a Data Scientist’s job easier.