
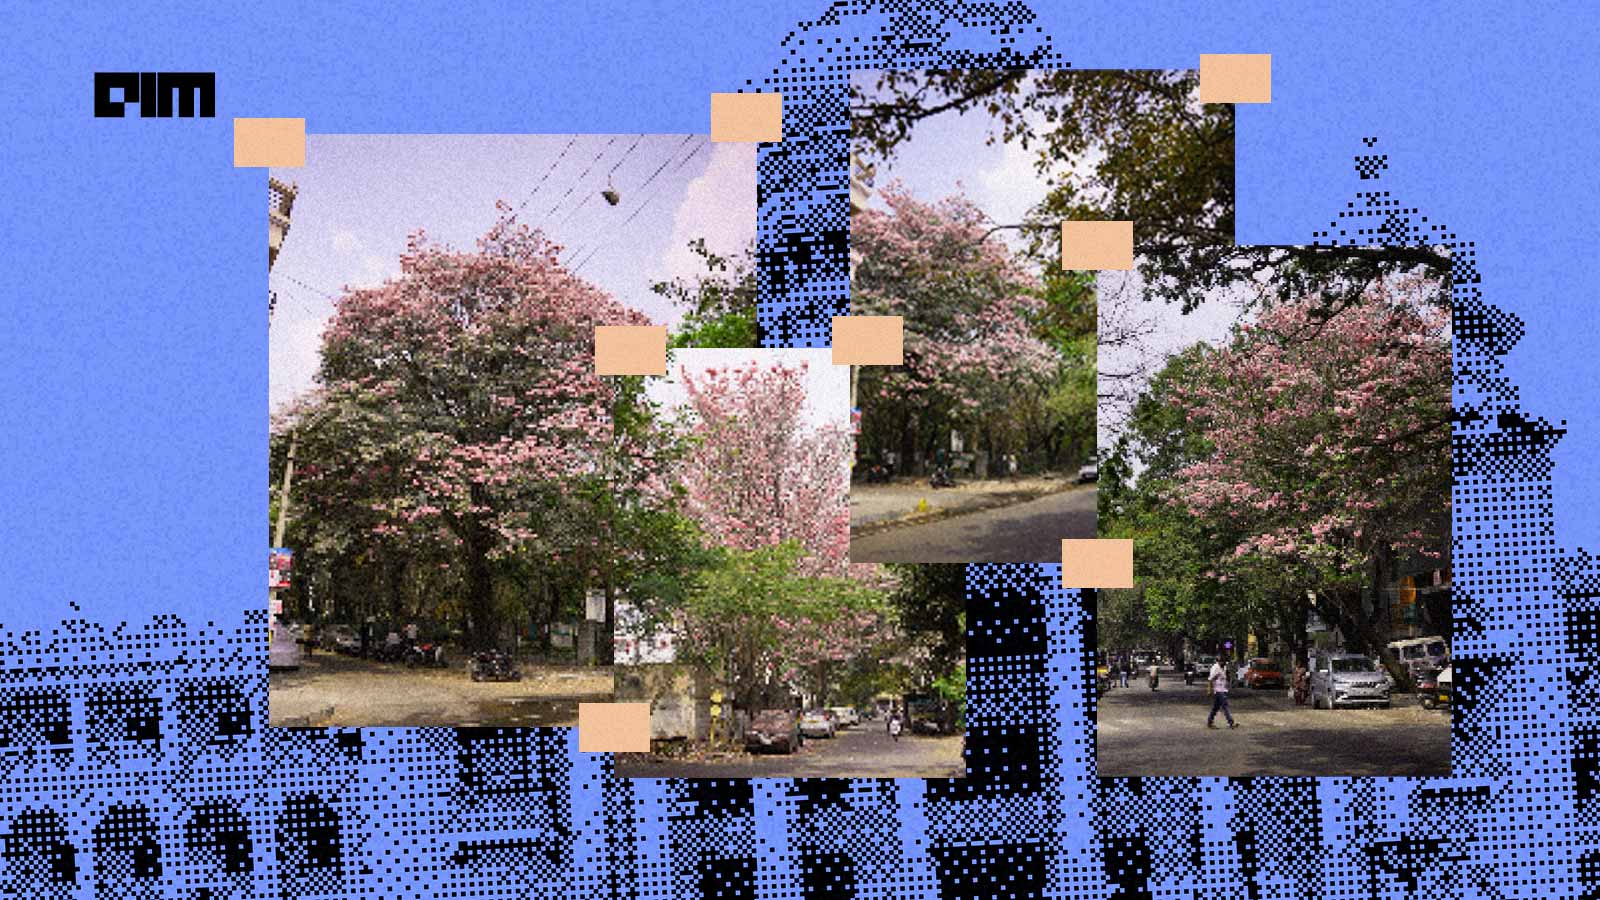
For Malavika S Menon, a 25-year-old senior software developer working in Bengaluru, the pink flush of the Tabebuia trees was more than just an opportunity for aesthetic Instagram posts. It was a data mine.
Each year, for a few weeks in spring, the city transforms into a pink fairytale. The roads are lined with rosy blooms, with the pink flowers of the Tabebuia rosea and impetiginosa trees—colloquially known as “Bengaluru’s cherry blossoms” and “pink trumpet trees”—also adorning neighbourhood parks and spilling over to quiet residential lanes.
Menon had been photographing the pink blossoms of Tabebuia rosea over several weeks, and wanted to analyse their geographic spread.
“Curious about how widespread they really were, I turned to BBMP’s (Bruhat Bengaluru Mahanagara Palike) open tree census dataset,” she tells AIM. The raw file contained data of thousands of tree flourishing across the city. Using QGIS, an open-source geographic information system software for analysing spatial data, she filtered the dataset to isolate Tabebuia rosea and plotted them against Bengaluru’s administrative boundary.
The result was a dense constellation of pink markers, roughly 21,000–and 27,000 trees, depending on classification.
“Running such a heavy dataset on her local machine was not smooth, and the software crashed a few times under the load. But within hours, I had exported a visualisation and posted it on X,” she adds.
The response was overwhelming.
Her post on X accumulated 139,000 views and over 3,500 impressions. Users were fascinated that the blooms they admired every year were part of a mapped and measurable urban forest.
As a big fan of the pink flower blooms in Bengaluru, I try to click pictures of these trees wherever I spot them. In that journey, I got curious and did a little research and plotted it on a map. There are around 27k tabebuia rosea trees in Bangalore currently. pic.twitter.com/OZGJbcunlS
— Malavika (@viksmals) February 23, 2026
Finding the Nearest Cluster
One of the comments on the X post was from Faris Mohammed, a 34-year-old product designer at a tech company, who had been noticing the trees while commuting daily from Mahadevpura to HSR Layout. He also wanted to visually map them, but as a community-driven project.
“I built “BlrBloom” a week ago, turning the data into a live, interactive tracker. It is a lightweight web app that maps Tabebuia rosea trees across the city,” he says.
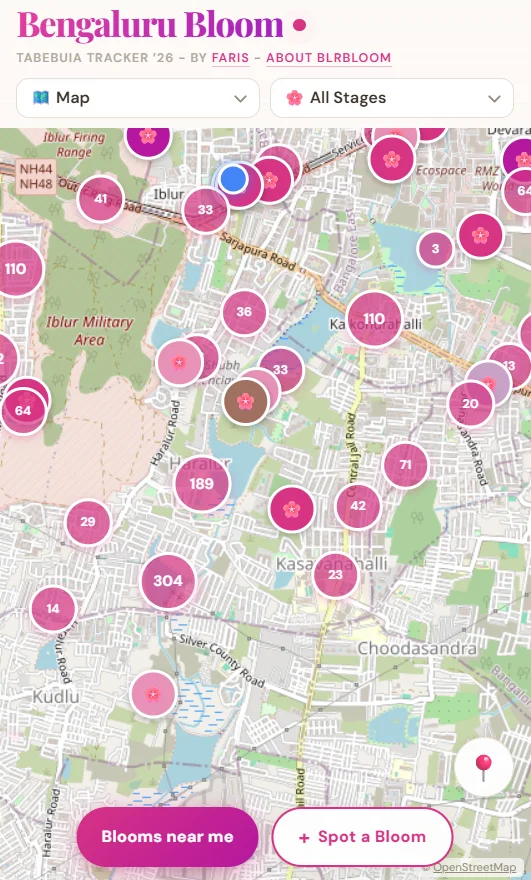
What started as a side project became an interactive Tabebuia blooming tracker to find and spot the beautiful trees.
Faris, who comes from a non-coding background, used AI tools such as the cloud-based coding platforms, including Anthropic Claude and Cursor to translate his idea into working code. “I know what needs to be built,” he remarks, describing his role as guiding the architecture while AI tools handled much of the coding execution.
The app integrates verified BBMP census data to plot tree coordinates on a dynamic map. Users can search by location, zoom in to nearby streets, and explore bloom pockets across Bengaluru.
BlrBloom moves beyond static data. It incorporates a crowdsourcing layer. Residents can add new sightings, upload images, and mark trees by stage, such as budding, full bloom or fading. He embedded a simple lifecycle logic in the system. A tree marked “full bloom” gradually transitions to “fading” after a few days, mirroring the flower’s short seasonal cycle. Each bloom lasts just three to five days.
The interactive tool features 20,939 mapped trees from the BBMP census and 256 trees spotted by community members, as of February 27. As more users contribute data, the map becomes more reflective of real-time conditions.
What began as a viral post quickly turned into a participatory urban tracker. The platform has drawn nearly 5,000 users in just a few days, entirely community-driven and fuelled by organic engagement on social media.
Together, the two projects illustrate a broader shift in civic tech engagement. Open government datasets, accessible GIS tools, and AI-assisted coding are lowering the barrier to building public-interest tools and applications.

Your reaction
Discussion
What's your take on this story?
No comments yet — be the first to share your view.